GoogleMapPlotter
class gmplot.GoogleMapPlotter(lat, lng, zoom, map_type='', apikey='', **kwargs)
Plotter that draws on a Google Map.
-
Parameters
-
lat
float– Latitude of the center of the map. -
lng
float– Longitude of the center of the map. -
zoom
int– Zoom level, where 0 is fully zoomed out.
-
-
Optional Parameters
-
map_type
str– Map type. -
apikey
str– Google Maps API key. -
title
str– Title of the HTML file (as it appears in the browser tab). -
map_styles
[dict]– Map styles. Requires Maps JavaScript API. -
tilt
int– Tilt of the map upon zooming in. -
scale_control
bool– Whether or not to display the scale control. Defaults to False. -
fit_bounds
dict– Fit the map to contain the given bounds, as a dict of the form{'north':, 'south':, 'east':, 'west':}.
-
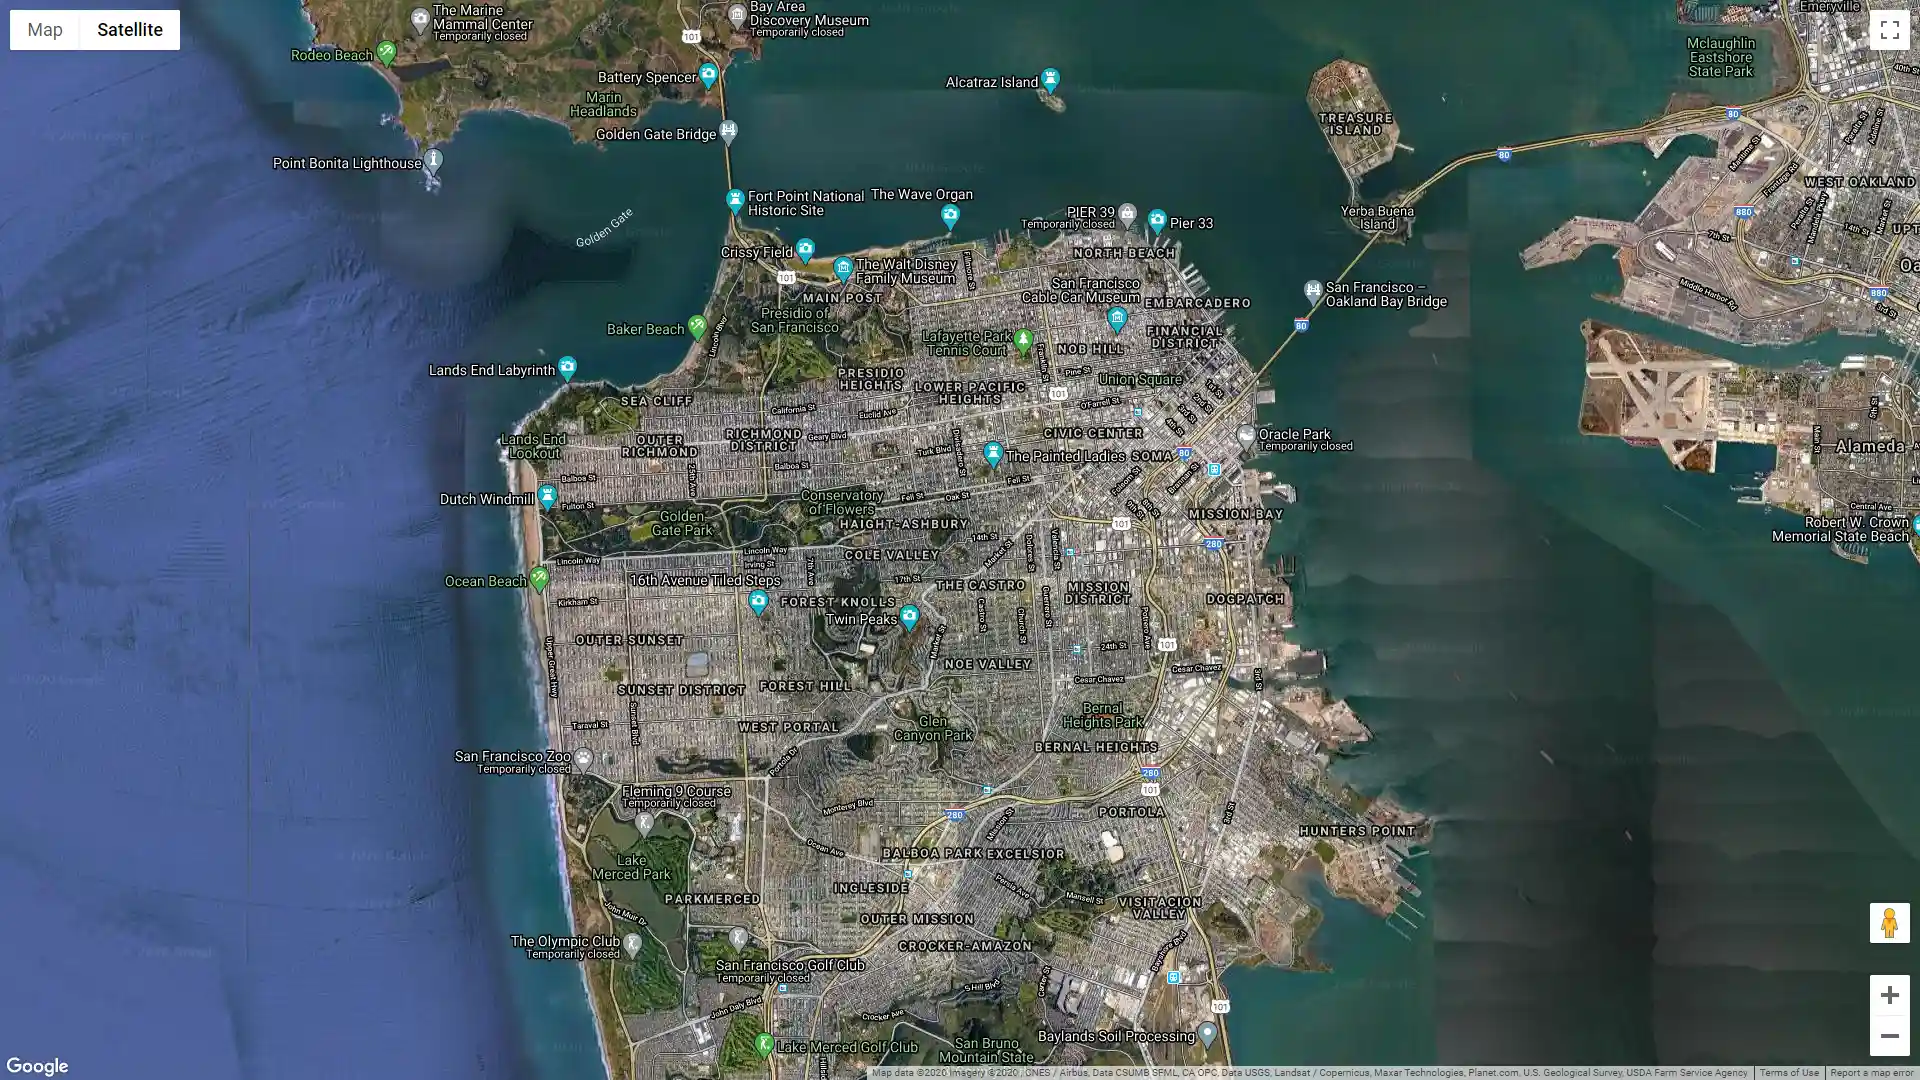
Usage:
import gmplot
apikey = '' # (your API key here)
gmap = gmplot.GoogleMapPlotter(37.7670, -122.4385, 13, apikey=apikey, map_type='hybrid')
gmap.draw("map.html")
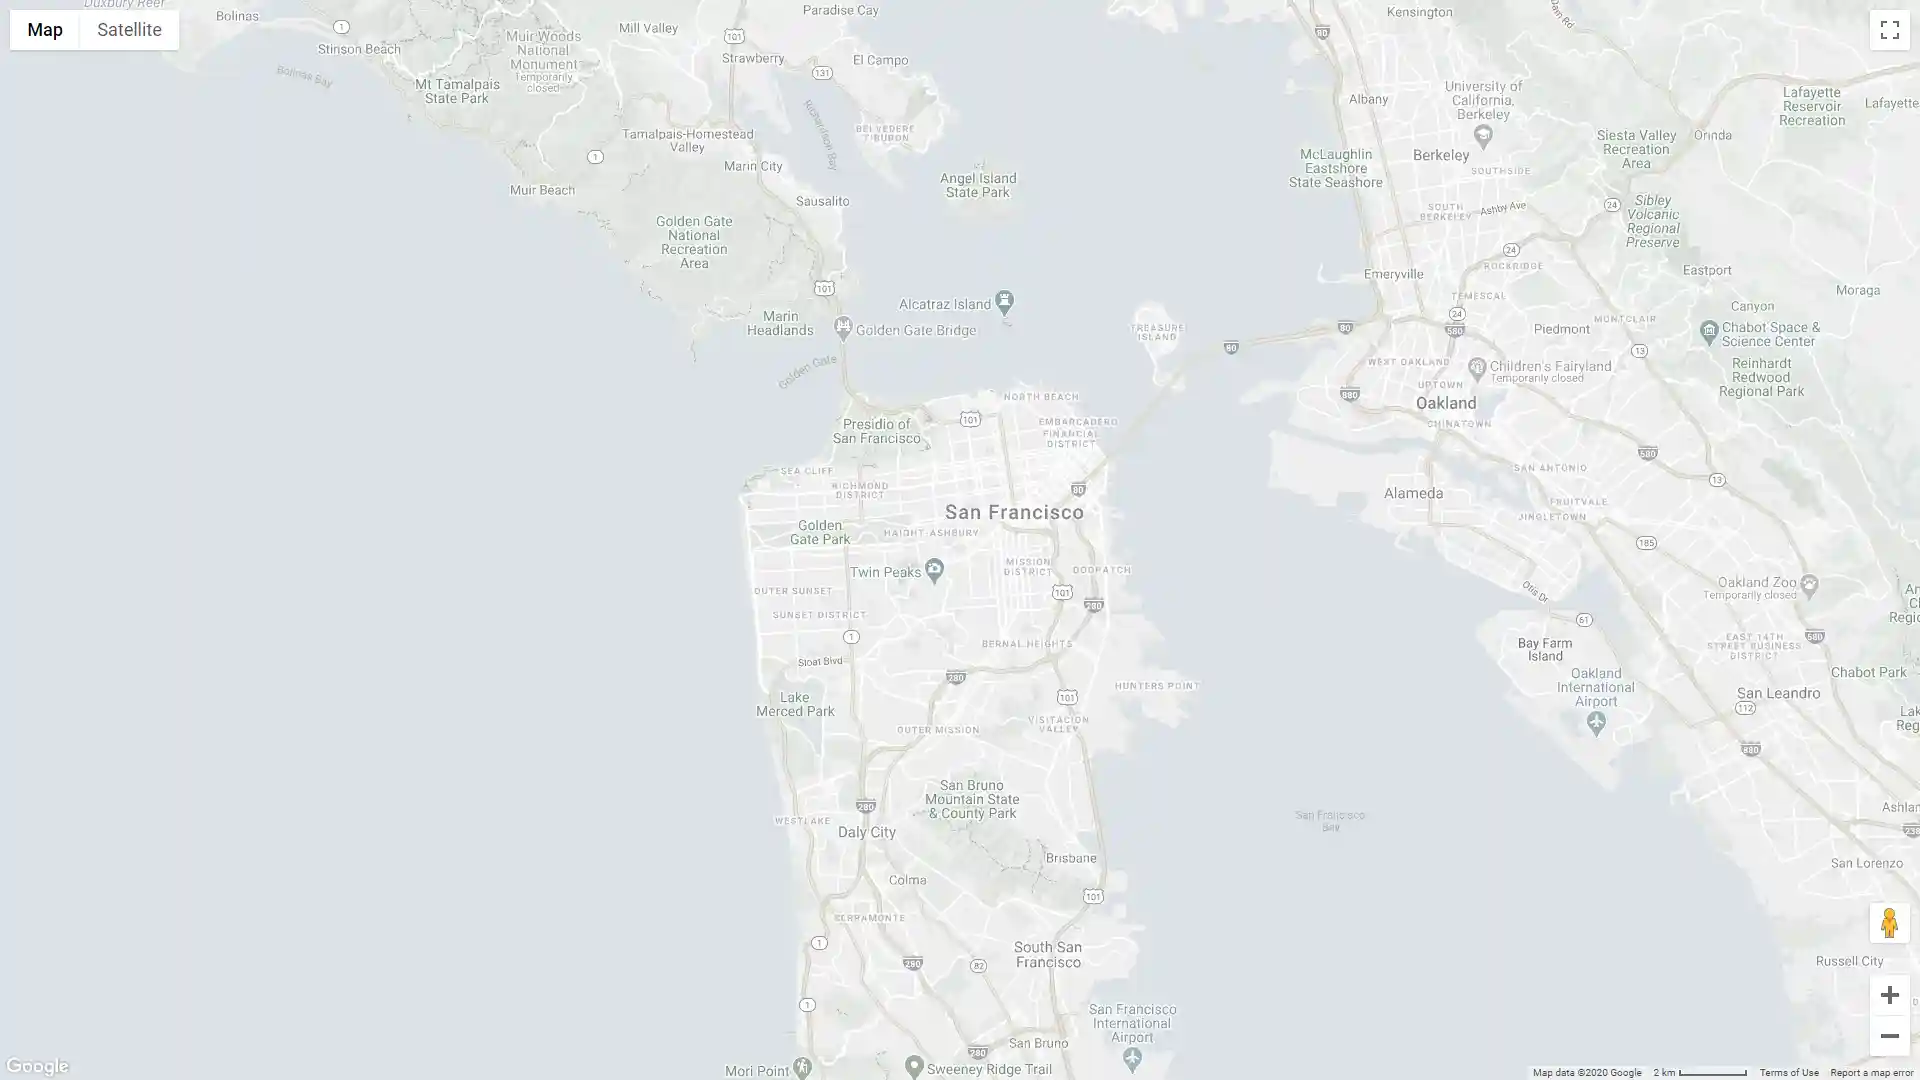
Further customization and styling:
import gmplot

apikey = '' # (your API key here)
bounds = {'north': 37.967, 'south': 37.567, 'east': -122.238, 'west': -122.638}
map_styles = [
    {
        'featureType': 'all',
        'stylers': [
            {'saturation': -80},
            {'lightness': 30},
        ]
    }
]

gmplot.GoogleMapPlotter(
    37.766956, -122.438481, 13,
    apikey=apikey,
    map_styles=map_styles,
    scale_control=True,
    fit_bounds=bounds
).draw("map.html")