GoogleMapPlotter.heatmap
GoogleMapPlotter.heatmap(lats, lngs, threshold=None, radius=10, gradient=None, opacity=0.6, max_intensity=1, dissipating=True, precision=6, weights=None)
Plot a heatmap.
-
Parameters
-
lats
[float]– Latitudes. -
lngs
[float]– Longitudes.
-
-
Optional Parameters
-
threshold – (Deprecated; use max_intensity instead.)
-
radius
int– Radius of influence for each data point, in pixels. Defaults to 10. -
gradient
[(int, int, int, float)]– Color gradient of the heatmap, as a list of RGBA colors. The color order defines the gradient moving towards the center of a point. -
opacity
float– Opacity of the heatmap, ranging from 0 to 1. Defaults to 0.6. -
max_intensity
int– Maximum intensity of the heatmap. Defaults to 1. -
dissipating
bool– True to dissipate the heatmap on zooming, False to disable dissipation. -
precision
int– Number of digits after the decimal to round to for lat/lng values. Defaults to 6. -
weights
[float]– List of weights corresponding to each data point. Each point has a weight of 1 by default. Specifying a weight of N is equivalent to plotting the same point N times.
-
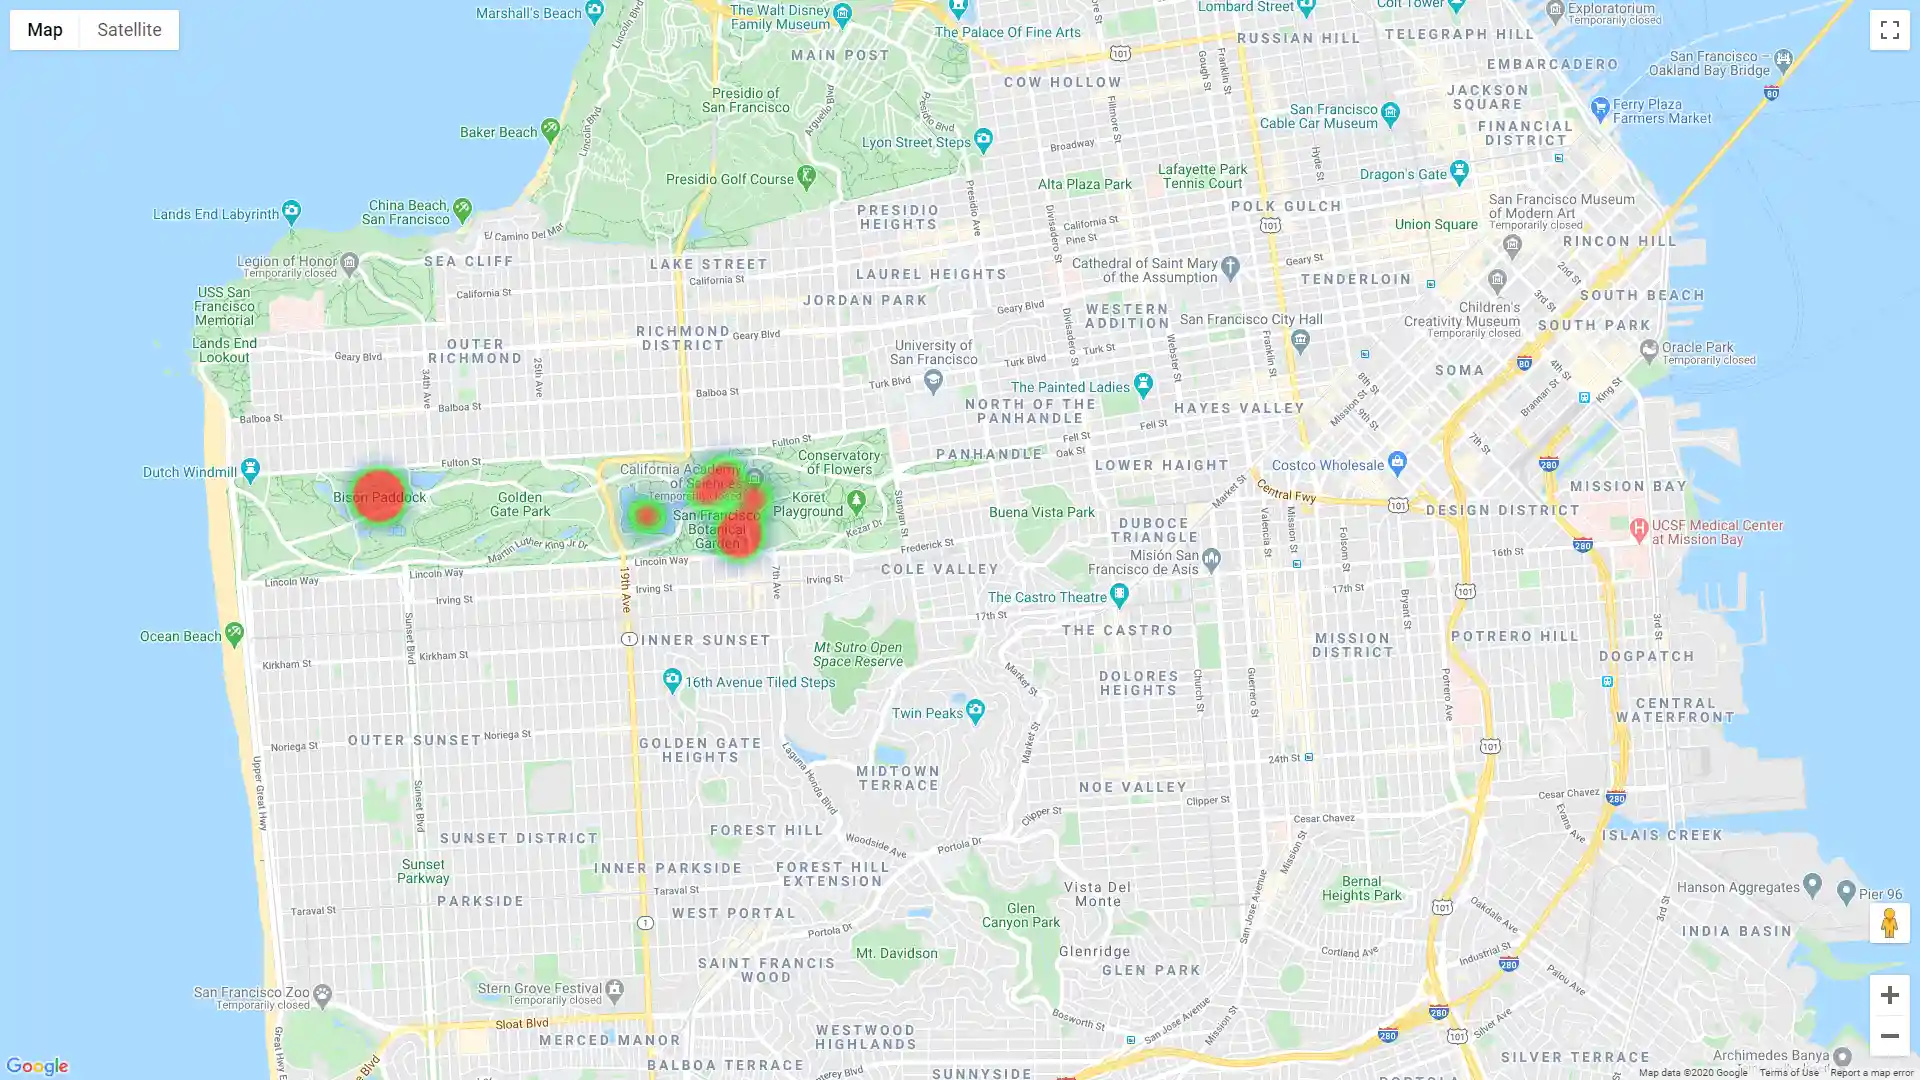
Usage:
import gmplot
apikey = '' # (your API key here)
gmap = gmplot.GoogleMapPlotter(37.766956, -122.448481, 14, apikey=apikey)

attractions = zip(*[
    (37.769901, -122.498331),
    (37.768645, -122.475328),
    (37.771478, -122.468677),
    (37.769867, -122.466102),
    (37.767187, -122.467496),
    (37.770104, -122.470436)
])

gmap.heatmap(
    *attractions,
    radius=40,
    weights=[5, 1, 1, 1, 3, 1],
    gradient=[(0, 0, 255, 0), (0, 255, 0, 0.9), (255, 0, 0, 1)]
)

gmap.draw('map.html')