GoogleMapPlotter.marker
GoogleMapPlotter.marker(lat, lng, color='#FF0000', c=None, title=None, precision=6, label=None, **kwargs)
Display a marker.
-
Parameters
-
lat
float– Latitude of the marker. -
lng
float– Longitude of the marker.
-
-
Optional Parameters
-
color/c
str– Marker color. Can be hex (‘#00FFFF’), named (‘cyan’), or matplotlib-like (‘c’). Defaults to red. -
title
str– Hover-over title of the marker. -
precision
int– Number of digits after the decimal to round to for lat/lng values. Defaults to 6. -
label
str– Label displayed on the marker. -
info_window
str– HTML content to be displayed in a pop-up info window. -
draggable
bool– Whether or not the marker is draggable.
-
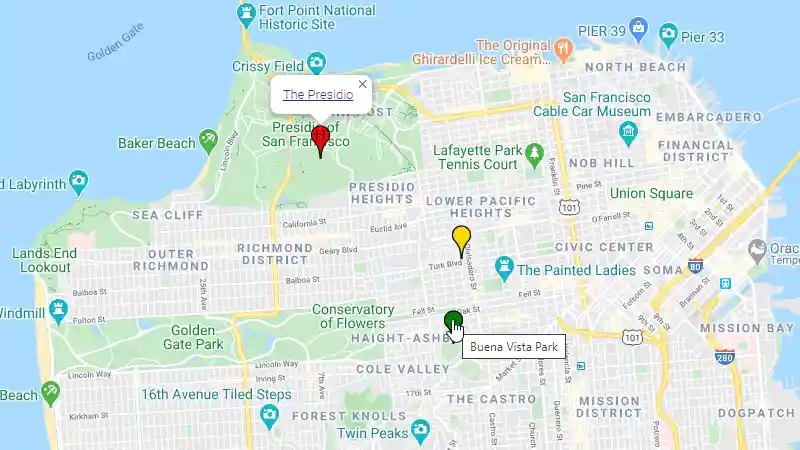
Usage:
import gmplot
apikey = '' # (your API key here)
gmap = gmplot.GoogleMapPlotter(37.766956, -122.438481, 13, apikey=apikey)

gmap.marker(37.793575, -122.464334, label='H', info_window="<a href='https://www.presidio.gov/'>The Presidio</a>")
gmap.marker(37.768442, -122.441472, color='green', title='Buena Vista Park')
gmap.marker(37.783333, -122.439494, precision=2, color='#FFD700')

gmap.draw('map.html')