Plot the top mean conditional minimal depth — plot_min_depth_interactions
Source: R/min_depth_interactions.R
plot_min_depth_interactions.Rd
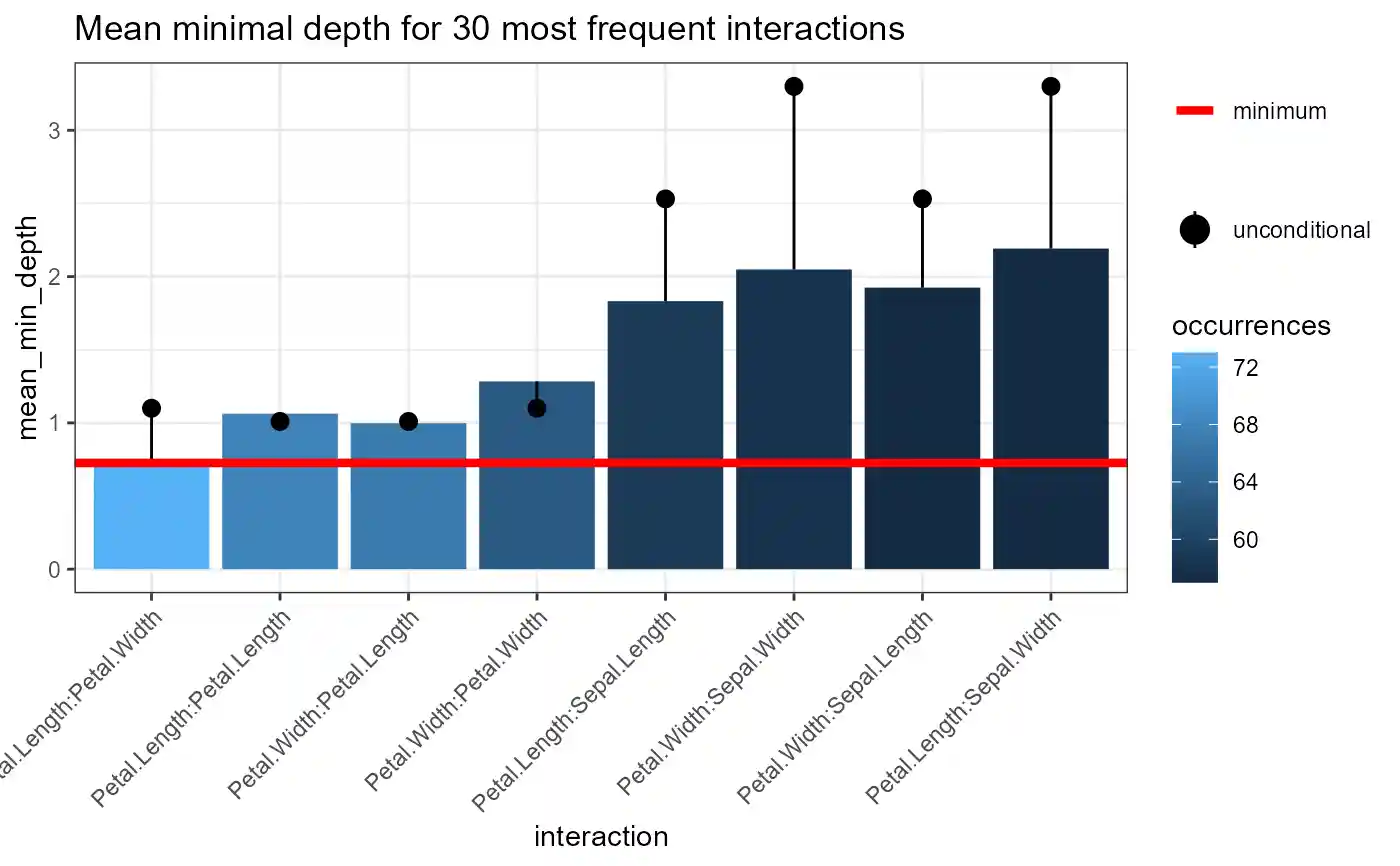
Plot the top mean conditional minimal depth
plot_min_depth_interactions(
  interactions_frame,
  k = 30,
  main = paste0("Mean minimal depth for ", paste0(k, " most frequent interactions"))
)
Arguments
- interactions_frame
A data frame produced by the min_depth_interactions() function or a randomForest object
- k
The number of best interactions to plot, if set to NULL then all plotted
- main
A string to be used as title of the plot
Value
A ggplot2 object
Examples
forest <- randomForest::randomForest(Species ~ ., data = iris, ntree = 100)
plot_min_depth_interactions(min_depth_interactions(forest, c("Petal.Width", "Petal.Length")))