API Monitoring | Dagger
API Monitoring refers to the practice of monitoring APIs in production to gain visibility into performance, availability and functional correctness. You want to get some insights about the metrics in real-time as soon as possible and possibly have some alerting mechanisms for unusual behaviour.
If you look closely, API health/uptime/performance is mostly a real-time streaming aggregation problem and hence Dagger can be a tool of choice. The only prerequisite is that you need some sort of structured events to be streamed for each API calls. The events can be streamed by the middleware/API gateway layer with all sort of information.
This is sample Data flow of API monitoring in Dagger.
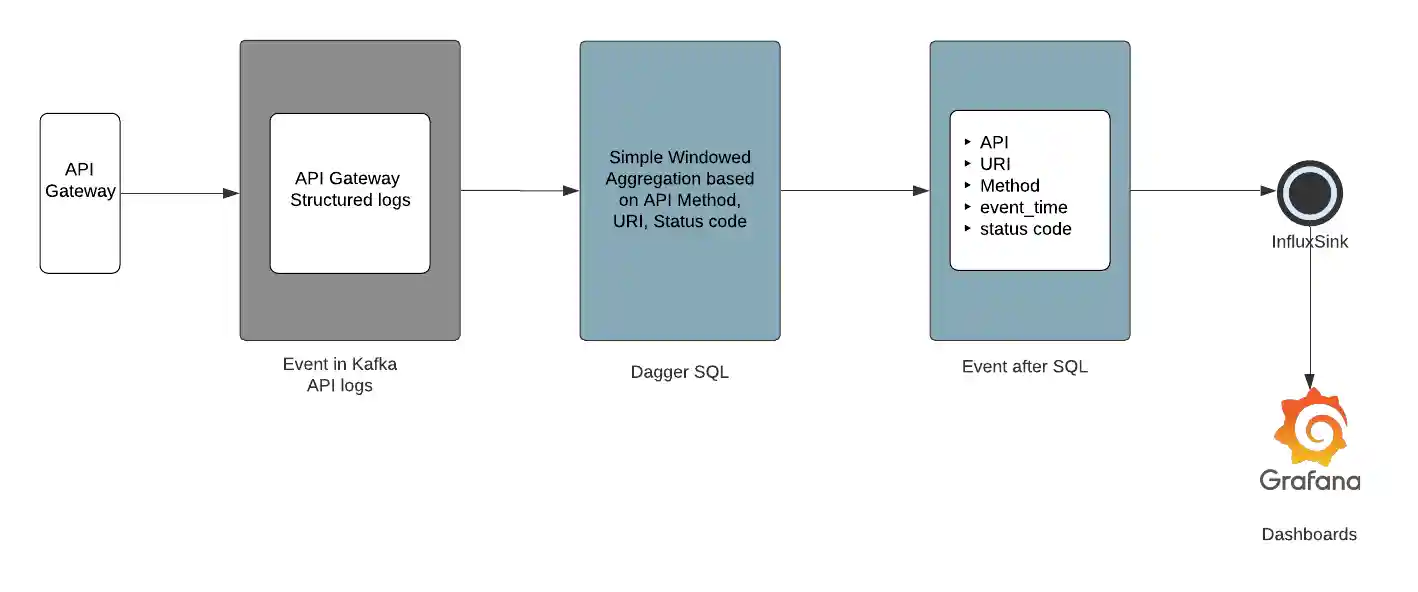
This is a sample schema of API logs.
We want to aggregate APIs on status codes. This will help us bucket APIs which are responding 4XX or 5XX and possibly have some issues.
SELECT api_name AS api_name, api_uri AS api_uri, api_method AS api_method, Cast(http_status_code AS BIGINT) as http_status_code, count(1) as request_count, Tumble_end(rowtime, INTERVAL '60' second) AS event_timestampFROM `api_logs`GROUP BY api_name, api_uri, http_status_code, api_method, Tumble (rowtime, INTERVAL '60' second)This is a Dashboard on a sample API based on the status code powered by Dagger.