server-side vs client-side tools in llm apis
30 Jan 2026
when building agentic applications with the anthropic api, understanding the difference between client tools and server tools is essential. they have different execution models, response structures, and handling requirements.
from the anthropic documentation:
Claude supports two types of tools:
- Client tools: Tools that execute on your systems
- Server tools: Tools that execute on Anthropic’s servers, like the web search and web fetch tools. These tools must be specified in the API request but don’t require implementation on your part.
| aspect | client tools | server tools |
|---|---|---|
| execution | your systems | anthropic’s servers |
| response handling | you must return tool_result |
results arrive automatically |
| content blocks | tool_use |
server_tool_use + web_search_tool_result |
| definition | input_schema object |
versioned type field |
defining each type
client tool - you provide a schema, claude generates input, you execute it:
{
  name: "get_weather",
  description: "Get the current weather in a given location",
  input_schema: {
    type: "object",
    properties: {
      location: {
        type: "string",
        description: "The city and state, e.g. San Francisco, CA"
      }
    },
    required: ["location"]
  }
}
server tool - you specify a versioned type, anthropic handles execution:
{
  type: "web_search_20250305",
  name: "web_search",
  max_uses: 5
}
server tools use versioned types (e.g., web_search_20250305) to ensure compatibility across model versions.
different workflows
client tool workflow
- you define the tool with a schema
- claude returns a
tool_useblock withstop_reason: "tool_use" - you execute the tool on your systems
- you return results via
tool_result - claude formulates the final response
// client tool response
{
  "stop_reason": "tool_use",
  "content": [
    {
      "type": "tool_use",
      "id": "toolu_01A09q90qw90lq917835lq9",
      "name": "get_weather",
      "input": {"location": "San Francisco, CA"}
    }
  ]
}
you then execute and return:
messages.push({
  role: "user",
  content: [{
    type: "tool_result",
    tool_use_id: "toolu_01A09q90qw90lq917835lq9",
    content: "72°F, sunny"
  }]
});
server tool workflow
- you specify the server tool in your request
- claude executes the tool automatically
- results are embedded in the response as
web_search_tool_result - no
tool_resultneeded from you - claude formulates the final response
// server tool response
{
  "content": [
    {
      "type": "text",
      "text": "I'll search for that information."
    },
    {
      "type": "server_tool_use",
      "id": "srvtoolu_01WYG3ziw53XMcoyKL4XcZmE",
      "name": "web_search",
      "input": { "query": "claude shannon birth date" }
    },
    {
      "type": "web_search_tool_result",
      "tool_use_id": "srvtoolu_01WYG3ziw53XMcoyKL4XcZmE",
      "content": [
        {
          "type": "web_search_result",
          "url": "https://en.wikipedia.org/wiki/Claude_Shannon",
          "title": "Claude Shannon - Wikipedia",
          "encrypted_content": "..."
        }
      ]
    },
    {
      "type": "text",
      "text": "Claude Shannon was born on April 30, 1916...",
      "citations": [...]
    }
  ]
}
the key difference: server tool results are already in the response. anthropic executed the search; you just continue the conversation.
handling both in an agentic loop
when building an agentic loop that uses both tool types, you need to distinguish between them:
if (response.stop_reason === "tool_use") {
  messages.push({ role: "assistant", content: response.content });

  // find client-side tools that need results
  const clientToolBlocks = response.content.filter(
    (block): block is Anthropic.ToolUseBlock =>
      block.type === "tool_use"
  );

  if (clientToolBlocks.length > 0) {
    // execute client tools and return results
    const toolResults: Anthropic.ToolResultBlockParam[] = [];
    for (const block of clientToolBlocks) {
      const result = await executeMyTool(block.name, block.input);
      toolResults.push({
        type: "tool_result",
        tool_use_id: block.id,
        content: result,
      });
    }
    messages.push({ role: "user", content: toolResults });
  }
}

// for server tools, check for server_tool_use blocks
const hasServerTool = response.content.some(
  block => block.type === "server_tool_use"
);
the server_tool_use block type tells you anthropic is handling execution. the results come back as web_search_tool_result blocks in the same response.
a common bug is treating server tools like client tools:
// wrong: sending tool_result for server-side tools
for (const block of response.content) {
  if (block.type === "tool_use") {
    toolResults.push({
      type: "tool_result",
      tool_use_id: block.id,
      content: "",  // what would you even put here?
    });
  }
}
this happens when code is adapted from client-tool examples without accounting for server tools. sending empty tool_result messages injects noise into the conversation - the model may interpret it as the tool failing.
pricing
server tools have usage-based pricing in addition to token costs. from the web search documentation:
Web search is available on the Claude API for $10 per 1,000 searches, plus standard token costs for search-generated content.
the usage is tracked in the response:
"usage": {
  "input_tokens": 105,
  "output_tokens": 6039,
  "server_tool_use": {
    "web_search_requests": 1
  }
}
key points
- client tools: you define, you execute, you return
tool_result - server tools: you specify, anthropic executes, results arrive automatically
- detect by block type:
tool_usevsserver_tool_use - never send
tool_resultfor server tools - the results are already in the response - server tools are versioned (e.g.,
web_search_20250305) for compatibility
references
- tool use with claude - official documentation
- web search tool - server tool example with pricing
migrating to zig 0.15: the roadblocks nobody warned you about
24 Oct 2025
i built a command-line security tool to analyze shell scripts before executing them (preventing those dangerous curl | bash situations). starting with zig 0.15 meant hitting every breaking change head-on. here’s what actually broke and how to fix it.
the project: safe-curl
the tool analyzes shell scripts for malicious patterns:
- recursive file deletion (
rm -rf /) - code obfuscation (base64 decoding, eval)
- privilege escalation (sudo)
- remote code execution
zig seemed perfect for a simple CLI tool with minimal dependencies. then i hit the 0.15 changes.
source: safe-curl on github
roadblock 1: arraylist requires allocator everywhere
the change: zig 0.15 replaced std.ArrayList with std.array_list.Managed as the default. the “managed” variant now requires passing an allocator to every method call.
official reasoning: zig 0.15 release notes explain: “Having an extra field is more complicated than not having an extra field.” the unmanaged variant is now the primary implementation, with the managed version as a wrapper.
what broke
my initial attempt looked like this:
const Finding = struct {
    severity: Severity,
    message: []const u8,
    line_num: usize,
};

const AnalysisResult = struct {
    findings: std.ArrayList(Finding),

    fn init(allocator: std.mem.Allocator) AnalysisResult {
        return .{
            .findings = std.ArrayList(Finding).init(allocator),
        };
    }

    fn addFinding(self: *AnalysisResult, finding: Finding) !void {
        try self.findings.append(finding);  // Error: missing allocator
    }
};
error message:
error: expected 2 arguments, found 1
the fix
you have two options in 0.15:
option 1: store the allocator and pass it to methods
const AnalysisResult = struct {
    findings: std.ArrayList(Finding),
    allocator: std.mem.Allocator,  // Store allocator

    fn init(allocator: std.mem.Allocator) AnalysisResult {
        return .{
            .findings = std.ArrayList(Finding).init(allocator),
            .allocator = allocator,
        };
    }

    fn addFinding(self: *AnalysisResult, finding: Finding) !void {
        try self.findings.append(self.allocator, finding);  // Pass allocator
    }

    fn deinit(self: *AnalysisResult) void {
        self.findings.deinit(self.allocator);  // Pass here too
    }
};
option 2: use the unmanaged variant
const AnalysisResult = struct {
    findings: std.ArrayListUnmanaged(Finding),

    fn init() AnalysisResult {
        return .{
            .findings = .{},  // Empty initialization
        };
    }

    fn addFinding(self: *AnalysisResult, allocator: std.mem.Allocator, finding: Finding) !void {
        try self.findings.append(allocator, finding);
    }

    fn deinit(self: *AnalysisResult, allocator: std.mem.Allocator) void {
        self.findings.deinit(allocator);
    }
};
i went with option 1 for familiarity, but option 2 is more idiomatic in 0.15.
why this change?
the zig team explains that storing the allocator in the struct adds complexity. with the unmanaged variant as default, you get:
- simpler method signatures
- static initialization support (
.{}) - explicit allocator lifetime management
trade-off: you pass the allocator everywhere, but your data structures are cleaner.
roadblock 2: empty struct initialization .{}
the pattern: zig 0.15 introduced a shorthand for empty struct initialization.
what this enables
before, initializing an empty arraylist required:
var findings = std.ArrayList(Finding).init(allocator);
now you can use struct field inference:
const AnalysisResult = struct {
    findings: std.ArrayList(Finding),

    fn init(allocator: std.mem.Allocator) AnalysisResult {
        return .{
            .findings = .{},  // Compiler infers std.ArrayList(Finding).init(allocator)
            .allocator = allocator,
        };
    }
};
this syntax confused me initially because .{} looks like an empty struct literal, but it actually calls the appropriate init function based on the field type.
when it works: field type is clear from context when it breaks: compiler can’t infer the type
var list: std.ArrayList(Item) = .{};  // Works
var list = .{};  // Error: cannot infer type
roadblock 3: process api breaking changes
the change: std.process.Child.run() return type changed significantly.
what broke
fn fetchFromUrl(allocator: std.mem.Allocator, url: []const u8) ![]const u8 {
    const result = try std.process.Child.run(.{
        .allocator = allocator,
        .argv = &[_][]const u8{ "curl", "-fsSL", url },
    });
    defer allocator.free(result.stderr);

    // This line broke
    if (result.term.Exited != 0) {
        allocator.free(result.stdout);
        return error.HttpRequestFailed;
    }

    return result.stdout;
}
error: no field named 'Exited' in union 'std.process.Child.Term'
the fix
the term field changed from having an Exited field to being a tagged union:
fn fetchFromUrl(allocator: std.mem.Allocator, url: []const u8) ![]const u8 {
    const result = try std.process.Child.run(.{
        .allocator = allocator,
        .argv = &[_][]const u8{ "curl", "-fsSL", url },
    });
    defer allocator.free(result.stderr);

    // Check the union variant properly
    switch (result.term) {
        .Exited => |code| {
            if (code != 0) {
                allocator.free(result.stdout);
                return error.HttpRequestFailed;
            }
        },
        else => {
            allocator.free(result.stdout);
            return error.ProcessFailed;
        },
    }

    return result.stdout;
}
this is more explicit about handling different termination types (signal, unknown, etc.).
roadblock 4: http client instability
the problem: zig’s std.http.Client is still evolving rapidly between versions.
what i tried
fn fetchFromUrl(allocator: std.mem.Allocator, url: []const u8) ![]const u8 {
    var client = std.http.Client{ .allocator = allocator };
    defer client.deinit();

    const uri = try std.Uri.parse(url);
    var server_header_buffer: [16384]u8 = undefined;

    var req = try client.open(.GET, uri, .{
        .server_header_buffer = &server_header_buffer,
    });
    defer req.deinit();

    try req.send();
    try req.wait();

    // ... read response
}
errors:
- API mismatches between documentation and actual implementation
- buffer size requirements unclear
- response reading patterns changed between minor versions
the workaround
the zig 0.15 release notes acknowledge: “HTTP client/server completely reworked to depend only on I/O streams, not networking directly.”
this instability meant falling back to shelling out:
fn fetchFromUrl(allocator: std.mem.Allocator, url: []const u8) ![]const u8 {
    // Use curl as a fallback since the Zig HTTP client API is too unstable
    const result = try std.process.Child.run(.{
        .allocator = allocator,
        .argv = &[_][]const u8{ "curl", "-fsSL", url },
    });
    defer allocator.free(result.stderr);

    switch (result.term) {
        .Exited => |code| {
            if (code != 0) {
                allocator.free(result.stdout);
                return error.HttpRequestFailed;
            }
        },
        else => {
            allocator.free(result.stdout);
            return error.ProcessFailed;
        },
    }

    return result.stdout;
}
not ideal for a “zero dependency” tool, but pragmatic given the api churn.
roadblock 5: reader/writer overhaul (“writergate”)
the change: zig 0.15 completely redesigned std.io.Reader and std.io.Writer interfaces.
from the release notes: “A complete overhaul of the standard library Reader and Writer interfaces… designed to usher in a new era of performance and drastically reduce unnecessary copies.”
what changed
before (0.14):
const stdout = std.io.getStdOut().writer();
try stdout.print("Hello {s}\n", .{"world"});
after (0.15):
const stdout = std.fs.File.stdout();
try stdout.writeAll("Hello world\n");

// For formatted output, you need a buffer
var stdout_buffer: [4096]u8 = undefined;
var stdout_writer = stdout.writer(&stdout_buffer);
try stdout_writer.print("Hello {s}\n", .{"world"});
why this matters
the old api wrapped streams in multiple layers of abstraction. the new api:
- builds buffering directly into reader/writer
- supports zero-copy operations (file-to-file transfers)
- provides precise error sets
- enables vector i/o and advanced operations
but it requires more explicit buffer management.
my approach
i created a helper function to hide the complexity:
fn printf(allocator: std.mem.Allocator, comptime fmt: []const u8, args: anytype) !void {
    const stdout = std.fs.File.stdout();
    const msg = try std.fmt.allocPrint(allocator, fmt, args);
    defer allocator.free(msg);
    try stdout.writeAll(msg);
}
this allocates for the formatted string, but keeps the call sites clean:
try printf(allocator, "{s}[{s}]{s} {s}\n", .{
    color_code,
    severity_name,
    Color.NC,
    finding.message
});
roadblock 6: undefined behavior rules tightened
the change: zig 0.15 standardizes when undefined is allowed.
from the release notes: “Only operators which can never trigger Illegal Behavior permit undefined as an operand.”
what this means
// This now errors at compile time
const x: i32 = undefined;
const y = x + 1;  // Error: undefined used in arithmetic

// Safe uses of undefined
var buffer: [256]u8 = undefined;  // OK: just reserves space
const ptr: *u8 = undefined;  // OK: pointers can be undefined
this catches bugs earlier but requires more explicit initialization.
the practical impact
in my code, i couldn’t do:
var line_num: usize = undefined;
while (condition) : (line_num += 1) {  // Error
    // ...
}
had to initialize explicitly:
var line_num: usize = 1;
while (condition) : (line_num += 1) {
    // ...
}
the verdict: worth it?
what’s better in 0.15:
- 5× faster debug compilation with x86 backend
- clearer allocator lifetime management
- more explicit, less magic
- better performance fundamentals
what hurts:
- breaking changes everywhere
- documentation lags behind implementation
- http client still unstable
- community examples are all outdated
resources
- zig 0.15.1 release notes - official breaking changes
- std.ArrayList documentation - new allocator patterns
- safe-curl source code - working 0.15 example
analyzing ocaml patterns in a real web app: what melange code actually looks like
15 Oct 2025
i built an options max pain calculator using melange (ocaml that compiles to javascript). this post analyzes the actual code—what patterns emerge, how the type system shapes the implementation, and what makes functional programming different in practice.
the project: what is max pain?
the app calculates “maximum pain” for stock options. this is the strike price where option holders (collectively) lose the most money at expiration.
here’s how it works:
the setup: every option contract has a strike price and open interest (number of contracts outstanding). at expiration, options are worth either:
- calls:
max(0, stock_price - strike)per share (100 shares per contract) - puts:
max(0, strike - stock_price)per share
the calculation: for each possible strike price, calculate total value of all calls + all puts if the stock expires at that price. the strike where this total is minimized is “max pain”—where option holders lose the most.
why it matters: some traders believe stocks tend to gravitate toward max pain at expiration due to market maker hedging. whether that’s true is debatable, but it’s an interesting calculation that requires processing options chain data.
the algorithm:
- fetch all option contracts (calls and puts) for an expiration date
- extract unique strike prices
- for each strike, sum up intrinsic value of all options if stock expires there
- find the strike with minimum total value
live demo: options-max-pain.pages.dev
this problem shows where ocaml differs from javascript/typescript:
- json parsing: requires explicit decoders instead of just calling
.json() - data transformations: immutable pipelines with fold instead of mutable loops
- error handling: option types and pattern matching instead of null checks
- finding the minimum: explicit handling of empty lists (can’t just return undefined)
let’s analyze how these patterns appear in the actual code.
pattern 1: types as documentation
ocaml makes you define your data structures upfront:
type optionContract = {
  strike: float,
  openInterest: int,
  optionType: string, /* "call" or "put" */
};

type painByStrike = {
  strike_price: float,
  call_pain: float,
  put_pain: float,
  total_pain: float,
};

type maxPainResult = {
  strikePrice: float,
  totalPain: float,
  painBreakdown: list(painByStrike),
};
what’s different from typescript:
- these aren’t optional annotations you can skip with
any - the compiler tracks every field access and ensures consistency
- misspell a field name anywhere? compile error
- try to access a field that doesn’t exist? compile error
- no runtime overhead—all this type information gets erased during compilation
this upfront ceremony pays off later. refactoring is mechanical: change a type, follow the compiler errors.
pattern 2: pipeline composition with the pipe operator
the core calculation looks like this:
let calculateMaxPain = (contracts: list(optionContract)): option(maxPainResult) => {
  /* get unique strike prices */
  let strikes =
    contracts
    |> List.map(c => c.strike)
    |> List.sort_uniq(compare);

  /* calculate pain for each strike */
  let painByStrikeList =
    strikes
    |> List.map(strike => {
         let (callPain, putPain) =
           contracts
           |> List.fold_left(
                (acc, contract) => {
                  let (accCallPain, accPutPain) = acc;
                  switch (contract.optionType) {
                  | "call" =>
                    let pain =
                      strike > contract.strike
                        ? (strike -. contract.strike)
                          *. float_of_int(contract.openInterest)
                          *. 100.0
                        : 0.0;
                    (accCallPain +. pain, accPutPain);
                  | "put" =>
                    let pain =
                      strike < contract.strike
                        ? (contract.strike -. strike)
                          *. float_of_int(contract.openInterest)
                          *. 100.0
                        : 0.0;
                    (accCallPain, accPutPain +. pain);
                  | _ => acc
                  };
                },
                (0.0, 0.0),
              );
         {
           strike_price: strike,
           call_pain: callPain,
           put_pain: putPain,
           total_pain: callPain +. putPain,
         };
       });

  /* find minimum pain strike */
  let minPainStrike =
    painByStrikeList
    |> List.fold_left(
         (minResult, current) =>
           switch (minResult) {
           | None => Some(current)
           | Some(min) =>
             current.total_pain < min.total_pain ? Some(current) : Some(min)
           },
         None,
       );

  /* return result */
  switch (minPainStrike) {
  | None => None
  | Some(minStrike) =>
    Some({
      strikePrice: minStrike.strike_price,
      totalPain: minStrike.total_pain,
      painBreakdown: painByStrikeList,
    })
  };
};
key patterns:
pipe operator (|>): threads data through transformations left-to-right. compare to javascript:
// javascript
const strikes = Array.from(
  new Set(contracts.map(c => c.strike))
).sort((a, b) => a - b);

// ocaml with pipes
let strikes =
  contracts
  |> List.map(c => c.strike)
  |> List.sort_uniq(compare);
fold_left for accumulation: like reduce() in javascript, but with explicit accumulator type. the tuple (accCallPain, accPutPain) carries both values through the fold. no mutation—each iteration returns a new tuple.
pattern matching for control flow: the switch on optionType is checked at compile time. the | _ => acc case handles unexpected values (though using a string here instead of a variant type is a missed opportunity).
return type is option(maxPainResult): this function might not have a result. what if the contracts list is empty? in javascript, you’d return null or undefined and hope callers check. in ocaml, the return type is explicitly option(maxPainResult):
type option('a) =
  | Some('a)
  | None;
callers must pattern match on the result:
switch (calculateMaxPain(contracts)) {
| Some(result) => /* use result.strikePrice */
| None => /* handle empty case */
}
the compiler won’t let you access result.strikePrice without handling the None case first. no silent failures, no forgotten null checks.
pattern 3: composable json decoders
the json parsing code is verbose but interesting:
|> Js.Promise.then_((json) => {
     open Melange_json.Of_json;

     /* compose decoders from small pieces */
     let decodeDetails = (json) => {
       let strikePrice = json |> field("strike_price", float);
       let contractType = json |> field("contract_type", string);
       (strikePrice, contractType);
     };

     let decodeResult = (json) => {
       let (strike, optionType) = json |> field("details", decodeDetails);
       let openInterest = json |> field("open_interest", int);
       {strike, openInterest, optionType};
     };

     try {
       let contracts =
         json
         |> field("results", array(decodeResult))
         |> Array.to_list;

       callback(Ok(contracts));
       Js.Promise.resolve();
     } {
       | Melange_json.Of_json_error(error) => {
         let msg = Melange_json.of_json_error_to_string(error);
         callback(Error("JSON decode error: " ++ msg));
         Js.Promise.resolve();
       }
     };
   })
trade-offs here:
in typescript, you’d write:
const response = await fetch(url);
const data = await response.json();
const contracts = data.results; // hope it's the right shape
in ocaml, you build composable decoders:
decodeDetailsdecodes nesteddetailsobjectdecodeResultusesdecodeDetailsto decode each array item- final decoder:
field("results", array(decodeResult))
upside: if the json doesn’t match, you get a specific error: “field ‘strike_price’ not found” or “expected float, got string”. the decoder tells you exactly what failed.
downside: you write the structure twice—once in the type definition, once in the decoder. every field requires explicit decoder logic.
what you gain: confidence. once decoded, the type system guarantees contracts is list(optionContract). no runtime type checking needed anywhere else in the codebase.
pattern 4: explicit nullability in react
the react component shows how the option type forces explicit error handling:
[@react.component]
let make = () => {
  let (result, setResult) = React.useState(() => None);
  let (error, setError) = React.useState(() => None);

  let handleCalculate = _ => {
    fetchOptionsData(
      ticker,
      expirationDate,
      response => {
        switch (response) {
        | Ok(contracts) =>
          let maxPain = calculateMaxPain(contracts);
          setResult(_ => maxPain);
        | Error(msg) => setError(_ => Some(msg))
        };
      },
    );
  };

  /* render jsx */
  <div>
    {switch (error) {
     | Some(msg) => <p> {React.string("Error: " ++ msg)} </p>
     | None => React.null
     }}
    {switch (result) {
     | Some({strikePrice, totalPain, painBreakdown}) =>
       <div>
         <p> {React.string("$" ++ Js.Float.toFixed(strikePrice))} </p>
       </div>
     | None => React.null
     }}
  </div>;
};
what’s happening:
state initialization: React.useState(() => None) creates state with an option type. error is option(string), result is option(maxPainResult). there’s no null or undefined—just None.
pattern matching in jsx: can’t access result.strikePrice directly. must pattern match:
switch (result) {
| Some({strikePrice, totalPain, painBreakdown}) => /* use it */
| None => React.null
}
the compiler won’t let you forget the None case.
explicit string wrapping: React.string() converts ocaml strings to react elements. this looks verbose, but it prevents accidentally rendering objects or functions. in typescript/react:
<p>{someObject}</p> // renders "[object Object]"
in ocaml:
<p> someObject </p> /* compile error: expected React.element, got object */
what the compiled javascript looks like
melange outputs readable javascript. here’s what calculateMaxPain compiles to:
function calculateMaxPain(contracts) {
  var strikes = List.sort_uniq(Caml_obj.compare, List.map(
    function (c) { return c.strike; },
    contracts
  ));

  var painByStrikeList = List.map(function (strike) {
    var match = List.fold_left(/* ... fold logic ... */, [0.0, 0.0], contracts);
    return {
      strike_price: strike,
      call_pain: match[0],
      put_pain: match[1],
      total_pain: match[0] + match[1]
    };
  }, strikes);

  // ... rest of function
}
observations:
- no type annotations - all stripped during compilation
- readable structure - mirrors the source ocaml
- minimal runtime - just a few helper functions for lists and comparisons
- no null checks - the compiler already verified everything
the types exist only at compile time. runtime javascript is clean and fast.
what i learned
the type system catches real bugs early
multiple times during development, i refactored the pain calculation logic. each time, the compiler caught every place that needed updating. change a field name? compiler shows every access. change a function signature? compiler shows every call site.
this isn’t theoretical. it saved me from shipping broken code.
json decoding is verbose but worth it
writing decoders feels like busy work at first. but when the api changed (polygon.io updated their response structure), i got immediate compile errors showing exactly which decoders needed updating. no silent failures. no runtime surprises.
pattern matching changes how you think
instead of defensive if (data && data.results && data.results.length > 0) checks everywhere, you model the states explicitly:
Nonewhen there’s no dataSome(data)when there is
the compiler ensures you handle both cases. no forgotten null checks.
the trade-off analysis
what you gain:
- soundness - if it compiles, types are guaranteed correct
- refactoring confidence - compiler guides you through changes
- explicit error handling - no forgotten null checks or error cases
- immutability by default - no accidental mutations
what you pay:
- upfront type ceremony - define types, write decoders, handle all cases
- smaller ecosystem - fewer libraries than typescript/javascript
- build complexity - opam + dune + webpack/bundler setup
- team learning curve - functional programming concepts aren’t mainstream
bottom line
analyzing this ocaml code shows functional programming isn’t just academic theory. the type system, pattern matching, and explicit error handling eliminate entire classes of bugs. but they require upfront investment in types and decoders.
the code is longer and more explicit than equivalent typescript. but it’s also more maintainable and correct by construction.
live demo: options-max-pain.pages.dev
lateral joins: the rails optimization nobody talks about
09 Oct 2025
i benchmarked lateral joins against window functions and N+1 queries for the classic “top N per group” problem in rails. lateral joins were 57% faster than window functions and 3.5x faster than N+1 queries.
here’s why almost nobody uses them, and why you should.
the problem: top N per group
you’ve hit this before. you have posts with comments. you want the top 3 highest-scored comments for each post.
# the N+1 approach (what most rails apps do)
@posts = Post.all
@posts.each do |post|
  post.comments.order(score: :desc).limit(3)
end
this works. it’s also slow. for 100 posts, that’s 101 queries.
most rails developers either live with the N+1 or preload everything into memory and filter in ruby. both options suck at scale.
there’s a better way hiding in plain sql: lateral joins.
what are lateral joins?
lateral joins let you write correlated subqueries that reference the outer query. think of it as a “for each row” loop at the database level.
SELECT posts.*, top_comments.*
FROM posts
LEFT JOIN LATERAL (
  SELECT comments.*
  FROM comments
  WHERE comments.post_id = posts.id  -- references outer query!
  ORDER BY score DESC
  LIMIT 3
) top_comments ON true
that WHERE comments.post_id = posts.id inside the subquery is the magic. for each post, postgres runs the inner query and limits to 3 results before doing anything else.
this means it’s only processing 300 rows (100 posts × 3 comments) instead of all 5,000 comments.
why nobody uses them in rails
- no native activerecord support - you have to write raw sql
- window functions exist - they solve the same problem and are easier to understand
- the problem is rare - most apps don’t hit scale where this matters
but when you do need them, the performance difference is massive.
the benchmark
i built a minimal activerecord benchmark comparing four approaches:
- N+1 queries (the rails way)
- window functions (the smart way)
- lateral joins (the postgres way)
- preload all + ruby filter (the memory-heavy way)
dataset: 100 posts, 50 comments each = 5,000 total comments. task: find top 3 comments per post.
sqlite3 results (no lateral support)
Window function (1 query):      363.3 i/s
N+1 queries (100 queries):       70.0 i/s - 5.19x slower
Preload all + Ruby filter:       34.2 i/s - 10.61x slower
note: i/s = iterations per second (higher is better). 363.3 i/s means the query completed 363 times in one second, or ~2.75ms per iteration.
window functions are already 5x faster than N+1 queries. nice speedup. let’s stop there, right?
wrong.
postgresql results (with lateral joins)
LATERAL join (1 query):         130.9 i/s - FASTEST
Window function (1 query):       83.2 i/s - 1.57x slower
N+1 queries (100 queries):       37.0 i/s - 3.53x slower
Preload all + Ruby filter:       11.8 i/s - 11.08x slower
lateral joins are 57% faster than window functions.
that’s not a typo. same dataset, same queries, lateral joins just win.
why lateral is faster: the execution plan
let’s look at what postgres actually does.
window function approach (12.5ms)
SELECT posts.*, comments.*
FROM posts
INNER JOIN (
  SELECT comments.*,
         ROW_NUMBER() OVER (PARTITION BY post_id ORDER BY score DESC) as row_num
  FROM comments
) comments ON comments.post_id = posts.id
WHERE comments.row_num <= 3
ORDER BY posts.id, comments.score DESC
postgres has to:
- scan all 5,000 comments
- compute ROW_NUMBER for every single row
- filter to row_num <= 3
- join with posts
it processes all 5,000 comments even though we only need 300 results.
lateral join approach (5.6ms)
SELECT posts.*, top_comments.*
FROM posts
LEFT JOIN LATERAL (
  SELECT comments.*
  FROM comments
  WHERE comments.post_id = posts.id
  ORDER BY score DESC
  LIMIT 3
) top_comments ON true
ORDER BY posts.id, top_comments.score DESC
postgres does:
- scan posts
- for each post, find top 3 comments using index on (post_id, score)
- stop after 3 rows per post
it only processes 300 comments total. the LIMIT happens inside the correlated subquery, so postgres can use indexes efficiently and bail early.
5.6ms vs 12.5ms - lateral is 2.2x faster in raw query execution time.
when the gap widens
the performance advantage scales with data volume. here’s where lateral really shines:
- 50 comments per post: lateral 1.57x faster
- 500 comments per post: lateral ~3x faster (estimated)
- 5,000 comments per post: lateral ~10x faster (estimated)
window functions process ALL comments. lateral processes top N per group and stops.
more posts
- 100 posts: save ~4ms per request
- 1,000 posts: save ~40ms per request
- 10,000 posts: save ~400ms per request
hot paths
if this query runs 1,000 times per second (homepage, api endpoint), lateral saves:
- 4.4ms × 1,000 = 4.4 seconds of total query time per second
that’s 4.4 seconds of database cpu you’re not paying for.
implementing lateral joins in rails
activerecord doesn’t support lateral natively, so you write raw sql. i usually wrap it in a scope:
class Post < ApplicationRecord
  has_many :comments

  def self.with_top_comments(limit = 3)
    sql = <<~SQL
      SELECT posts.*, top_comments.*
      FROM posts
      LEFT JOIN LATERAL (
        SELECT comments.*
        FROM comments
        WHERE comments.post_id = posts.id
        ORDER BY score DESC
        LIMIT #{sanitize_sql(limit)}
      ) top_comments ON true
      ORDER BY posts.id, top_comments.score DESC
    SQL

    connection.exec_query(sql)
  end
end
then use it like any query:
results = Post.with_top_comments(3)
you can also build it with arel if you want more composability:
def self.with_top_comments(limit = 3)
  lateral_query = Comment
    .where('comments.post_id = posts.id')
    .order(score: :desc)
    .limit(limit)
    .to_sql

  from("posts")
    .joins("LEFT JOIN LATERAL (#{lateral_query}) top_comments ON true")
    .select('posts.*, top_comments.*')
end
not as clean as activerecord, but not terrible either.
the complete benchmark code
#!/usr/bin/env ruby
require 'bundler/inline'

gemfile do
  source 'https://rubygems.org'
  gem 'activerecord', '~> 7.0'
  gem 'pg'
  gem 'benchmark-ips'
end

require 'active_record'
require 'benchmark/ips'

# setup database
ActiveRecord::Base.establish_connection(
  adapter: 'postgresql',
  database: 'benchmark_db',
  username: ENV['USER']
)

# create schema
ActiveRecord::Schema.define do
  create_table :posts, force: true do |t|
    t.string :title
  end

  create_table :comments, force: true do |t|
    t.integer :post_id
    t.integer :score
  end

  add_index :comments, [:post_id, :score]
end

# models
class Post < ActiveRecord::Base
  has_many :comments
end

class Comment < ActiveRecord::Base
  belongs_to :post
end

# seed data
100.times do |i|
  post = Post.create!(title: "Post #{i}")
  50.times { Comment.create!(post_id: post.id, score: rand(1..100)) }
end

# benchmark approaches
def approach_lateral(top_n)
  sql = <<~SQL
    SELECT posts.*, top_comments.*
    FROM posts
    LEFT JOIN LATERAL (
      SELECT comments.*
      FROM comments
      WHERE comments.post_id = posts.id
      ORDER BY score DESC
      LIMIT #{top_n}
    ) top_comments ON true
  SQL

  ActiveRecord::Base.connection.exec_query(sql)
end

def approach_window(top_n)
  sql = <<~SQL
    SELECT posts.*, comments.*
    FROM posts
    INNER JOIN (
      SELECT comments.*,
             ROW_NUMBER() OVER (PARTITION BY post_id ORDER BY score DESC) as row_num
      FROM comments
    ) comments ON comments.post_id = posts.id
    WHERE comments.row_num <= #{top_n}
  SQL

  ActiveRecord::Base.connection.exec_query(sql)
end

Benchmark.ips do |x|
  x.report("LATERAL join") { approach_lateral(3) }
  x.report("Window function") { approach_window(3) }
  x.compare!
end
run with:
ruby lateral_join_benchmark_postgres.rb
it creates a test database, seeds data, runs benchmarks, and cleans up. takes about 30 seconds.
you can adjust the dataset size by changing NUM_POSTS and COMMENTS_PER_POST at the top of the script.
real-world use cases
class PostsController < ApplicationController
  def index
    @posts = Post.with_top_comments(5)
  end
end
instead of N+1 queries or eager loading thousands of comments, one lateral query gets exactly what you need.
analytics: “show top 10 products by revenue per category”
SELECT categories.*, top_products.*
FROM categories
LEFT JOIN LATERAL (
  SELECT products.*, SUM(order_items.price) as revenue
  FROM products
  JOIN order_items ON order_items.product_id = products.id
  WHERE products.category_id = categories.id
  GROUP BY products.id
  ORDER BY revenue DESC
  LIMIT 10
) top_products ON true
this would be brutal with window functions on millions of order items.
“most active users per region”
SELECT regions.*, active_users.*
FROM regions
LEFT JOIN LATERAL (
  SELECT users.*, COUNT(activities.id) as activity_count
  FROM users
  JOIN activities ON activities.user_id = users.id
  WHERE users.region_id = regions.id
  GROUP BY users.id
  ORDER BY activity_count DESC
  LIMIT 20
) active_users ON true
lateral lets you push down the LIMIT before aggregating. huge win.
window functions vs lateral: when to use which
use window functions when:
- you need all rows with ranking metadata (e.g., show every comment with its rank)
- database doesn’t support lateral (mysql pre-8.0.14)
- query is already fast enough
use lateral when:
- you only need top N per group
- dataset is large (10k+ rows per group)
- query is on a hot path
- you have proper indexes on join/order columns
lateral requires indexes on (group_column, order_column) to be fast. in our case: (post_id, score).
without indexes, lateral can actually be slower than window functions because it’s running N correlated subqueries.
other databases
postgresql: native support since 9.3 (2013). works great.
sqlite: added in 3.39.0 (2022), but not widely deployed. most rails apps on older sqlite.
mysql: supports lateral since 8.0.14 (2019). same syntax, slightly different optimizer behavior.
sql server: uses CROSS APPLY instead of CROSS JOIN LATERAL. same concept.
gotchas
correlated subquery performance: lateral executes the inner query for each outer row. bad indexes = bad performance.
result shape: lateral returns flattened rows. you get (post1, comment1), (post1, comment2), (post1, comment3) not nested objects. you have to group in ruby if you need nesting.
results = Post.with_top_comments(3)

posts_hash = results.group_by { |row| row['post_id'] }
posts_hash.each do |post_id, rows|
  post = rows.first
  comments = rows.map { |r| r.slice('comment_id', 'body', 'score') }
  # do something with post and comments
end
sql injection: if you’re interpolating user input into the lateral query, sanitize it:
lateral_query = Comment
  .where('comments.post_id = posts.id')
  .where('comments.author = ?', params[:author])  # sanitized
  .order(score: :desc)
  .limit(sanitize_sql(limit))
  .to_sql
why this matters
let’s be clear: N+1 queries are never fine. always eager load with includes() as your default. even on small datasets, N+1 queries waste round-trip time and teach bad habits.
but eager loading has its own problem for “top N per group” queries:
# eager loading still loads ALL comments
@posts = Post.includes(:comments).limit(100)

# then you filter in ruby
@posts.each do |post|
  top_3 = post.comments.sort_by(&:score).reverse.take(3)
end
you’ve loaded 5,000 comments into memory when you only need 300. that’s where lateral joins shine.
“can’t you eager load and then filter via SQL?” you can add SQL conditions to eager loading:
# this works for global filters
@posts = Post.includes(:comments)
  .where("comments.score > ?", 50)
  .references(:comments)
but there’s no way to do “top N per group” with includes(). activerecord’s eager loading loads entire associations - you can’t tell it to “only load the top 3 comments per post” without writing custom SQL. at that point, you might as well use lateral joins or window functions.
lateral joins aren’t a fix for lazy N+1 queries. they’re an optimization on top of good eager loading practices.
they solve the specific case where:
- you’ve already eliminated N+1 queries with eager loading
- but you’re loading too much data because you only need a subset per group
- and filtering in ruby is inefficient at scale
the frustrating part is that rails doesn’t make this easy. no native activerecord support. you have to know postgres-specific features and drop down to raw sql.
but 57% faster query execution is worth writing some sql.
the bottom line
- lateral joins are 1.57x faster than window functions for top N per group queries
- they scale better with data volume
- they require proper indexes to be fast
- activerecord doesn’t support them natively
- most rails apps don’t need them, but when you do, they’re a massive win
if you’re doing “top N per group” queries at scale, benchmark lateral joins. they might surprise you.
Debugging GitHub's Pinned Items Performance Issue in Safari
07 Oct 2025
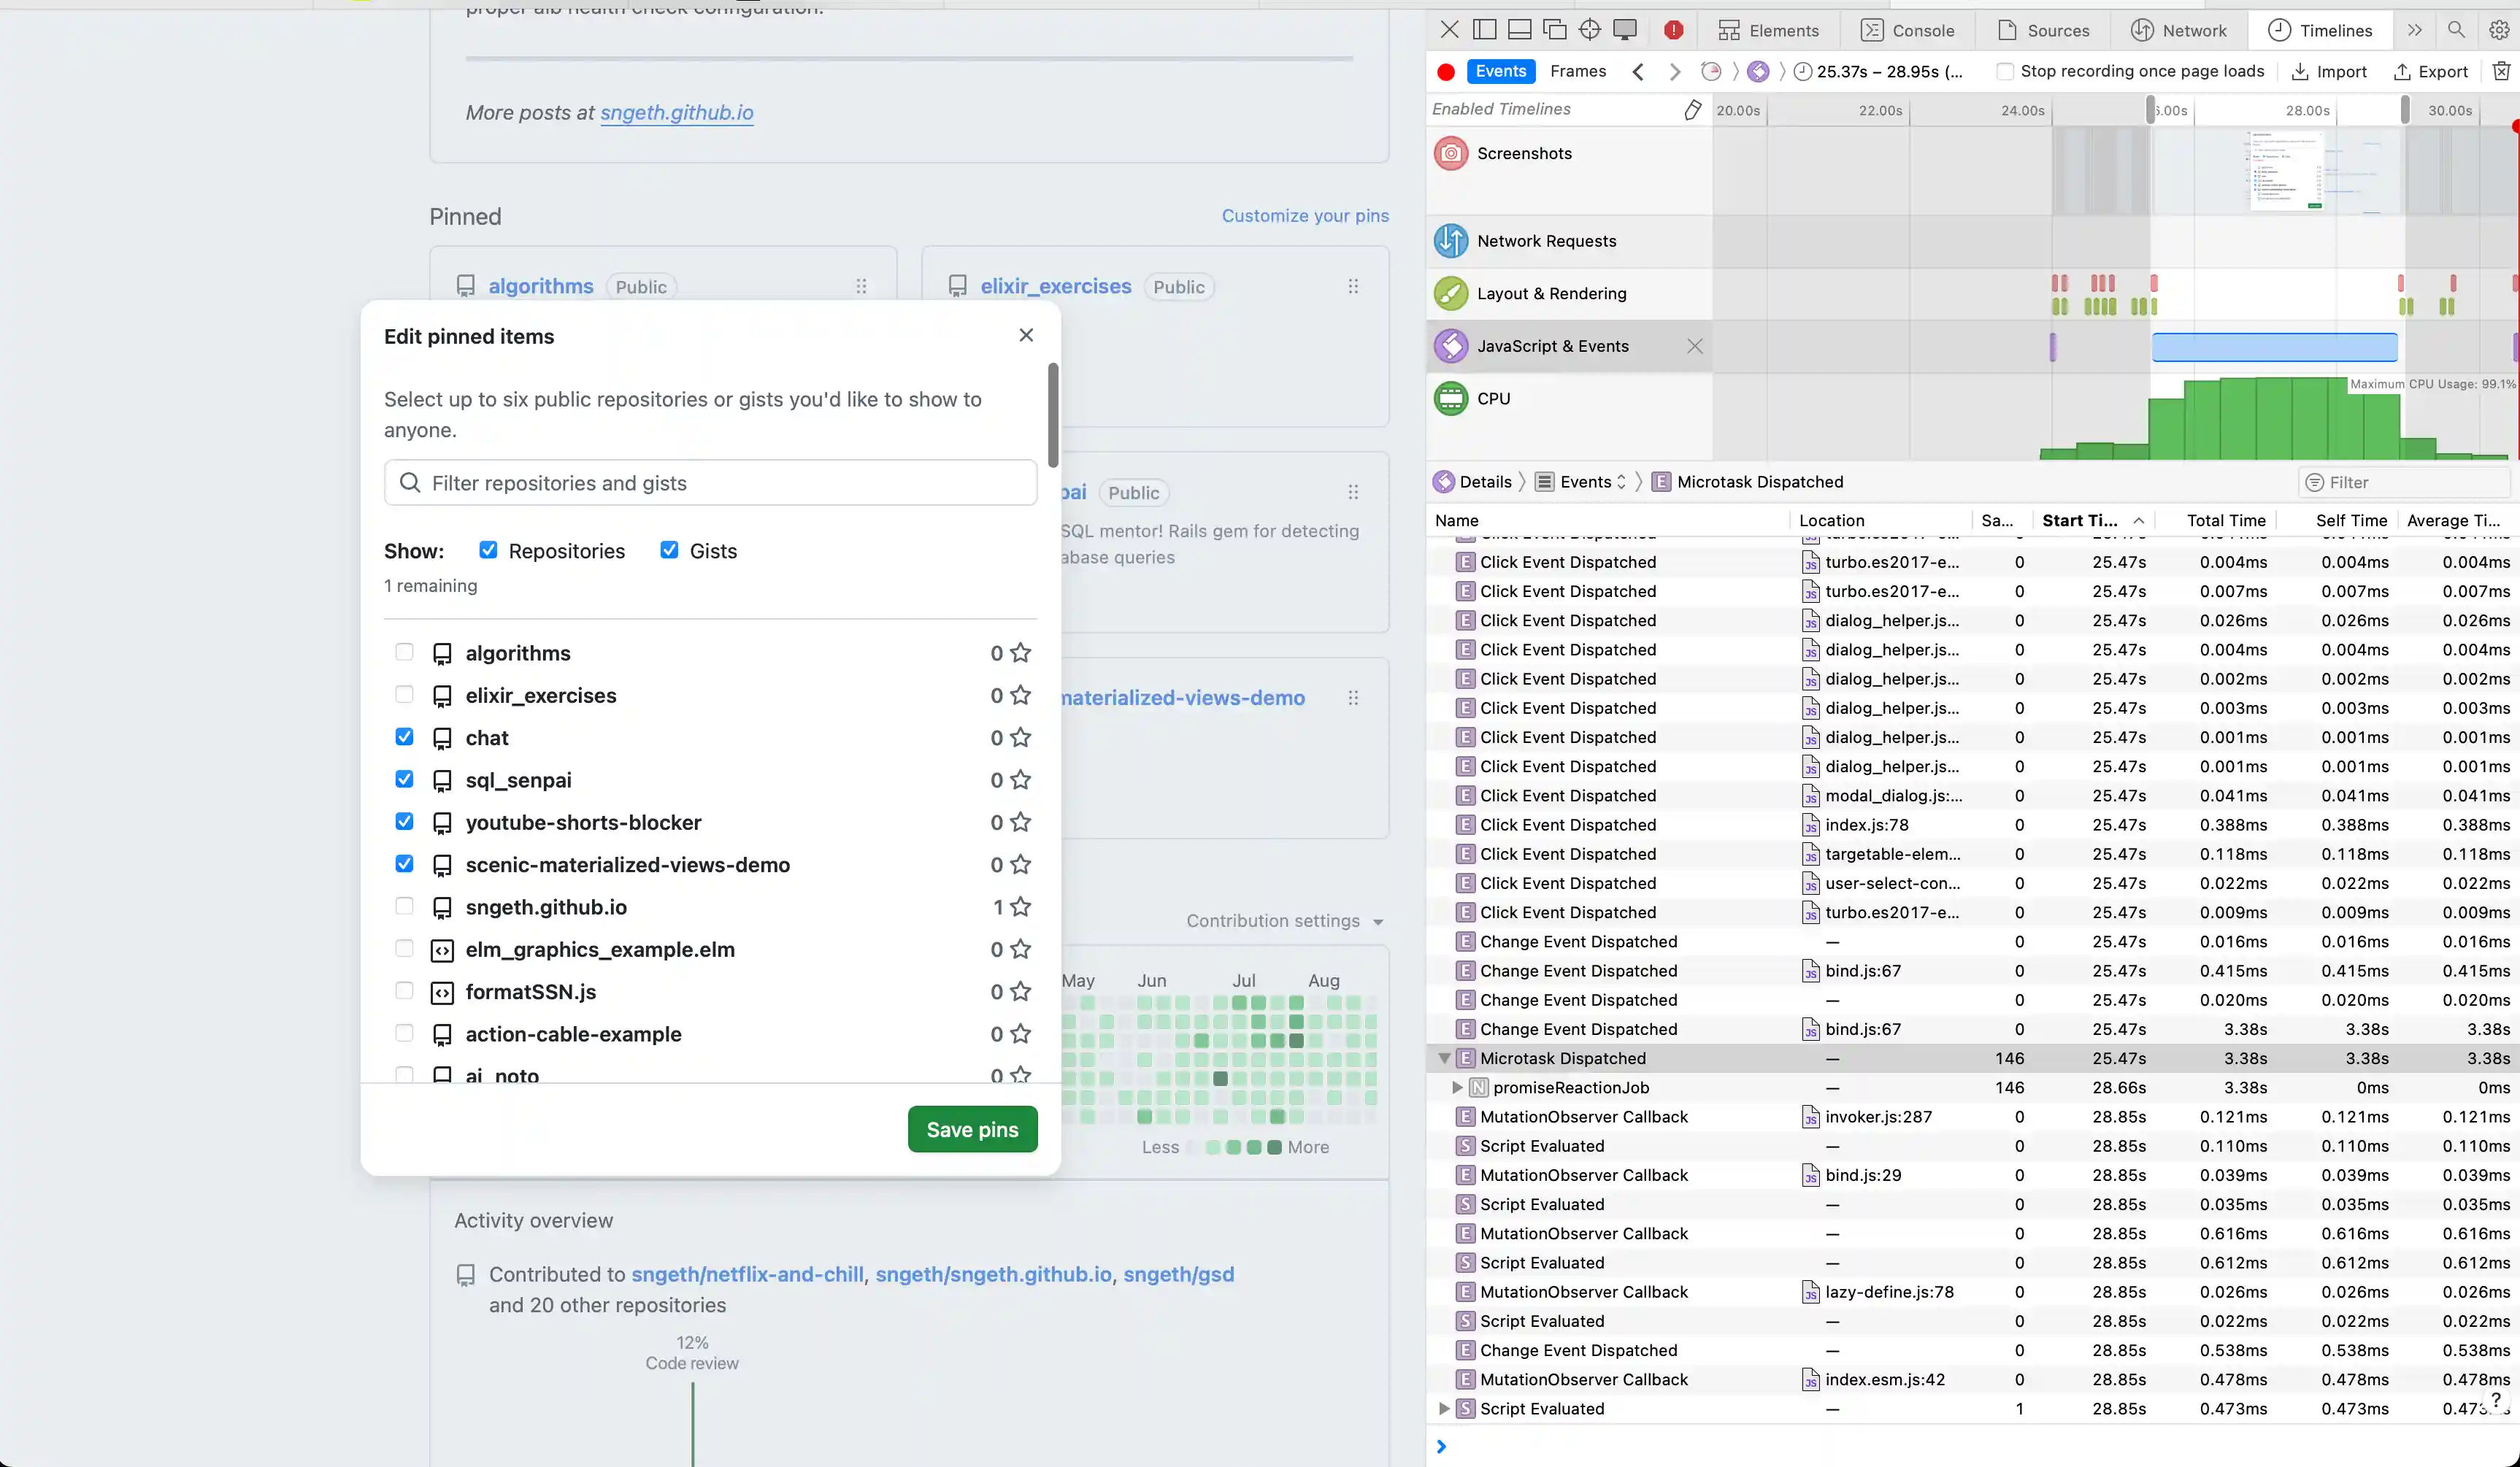
I recently encountered a frustrating performance issue on GitHub’s profile settings page. When trying to pin repositories to my profile, each checkbox click would freeze for several seconds in Safari, but worked instantly in Firefox. This is a case study of how I used Safari’s Timelines tool to track down the root cause.
The Problem
On GitHub’s “Edit pinned items” dialog, clicking a checkbox to pin/unpin a repository had a 3-4 second delay before the checkbox would visually update - but only in Safari. Firefox was instant.
Initial Investigation
My first instinct was to determine if this was a backend or frontend issue. I opened Safari DevTools and recorded a Timeline profile while clicking a checkbox.
What I Found
The Timeline showed:
- Minimal network activity - No API calls during the delay
- Fast JavaScript execution - Initial event handlers completed in ~43ms
- Long Layout & Rendering gap - Seconds of nothing happening
- Massive JavaScript & Events block - A 3.5 second JavaScript execution block
This ruled out backend issues. The problem was entirely in the frontend.
Digging Deeper
I added some instrumentation to measure the checkbox event handling:
document.querySelectorAll('input[type="checkbox"]').forEach(checkbox => {
  checkbox.addEventListener('change', (e) => {
    console.time('checkbox-change');
  }, true);

  checkbox.addEventListener('change', (e) => {
    console.timeEnd('checkbox-change');
  }, false);
});
The result: 43ms. The JavaScript completed quickly, but the visual update took 3+ seconds.
This was confusing - if JavaScript finished in 43ms, why did it take seconds to render?
The Real Culprit
Looking more carefully at the Timeline, I noticed a second “Change Event Dispatched” that took 3.47 seconds. The 43ms I measured was just the first event handler.
Clicking into that slow event revealed the call stack pointing to bind.js:67 - part of GitHub Catalyst, GitHub’s web component framework.
The Catalyst Event System
GitHub uses Catalyst’s event binding system. Here’s the handleEvent function from bind.ts:
function handleEvent(event) {
  const el = event.currentTarget;
  for (const binding of bindings(el)) {
    if (event.type === binding.type) {
      const controller = el.closest(binding.tag);
      if (controllers.has(controller) && typeof controller[binding.method] === 'function') {
        controller[binding.method](event);
      }
      // ... Shadow DOM handling
    }
  }
}
This routes events to web component controller methods. In this case, the checkbox change event was calling ProfilePinsElement.limitPins().
The Performance Bug
Here’s the limitPins() method from GitHub’s source:
async limitPins() {
  await Promise.resolve()
  const checkboxes = this.checkboxes  // queries ALL checkboxes
  const used = checkboxes.filter(el => el.checked).length
  const limit = parseInt(this.getAttribute('max')!, 10)

  for (const el of checkboxes) {
    el.disabled = used === limit && !el.checked
  }

  const label = this.limitNotice.getAttribute('data-remaining-label') || ''
  const diff = limit - used
  this.limitNotice.textContent = `${diff} ${label}`
  this.limitNotice.classList.toggle('color-fg-danger', diff < 1)
}
The issue? Scale.
The dialog loads up to 100 pages of repositories (controlled by autoreloadCount = 100). For a user with 100+ repositories, this means:
this.checkboxesqueries 100+ checkbox elements from the DOM.filter(el => el.checked)loops through 100+ checkboxesfor (const el of checkboxes)loops through 100+ again setting.disabled- Each
.disabled = ...triggers:- Style recalculation (
:disabledpseudo-class) - MutationObserver callbacks
- Layout updates
- Style recalculation (
100+ DOM property updates × Safari’s slower DOM performance = 3.5 seconds
Why Safari and Not Firefox?
Safari’s JavaScript engine (JavaScriptCore) and rendering engine (WebKit) are notoriously slower at certain DOM operations compared to Firefox’s SpiderMonkey and Gecko:
- DOM property access (
.checked,.disabled) - Style recalculation for pseudo-classes
- MutationObserver callbacks
- Layout computation
Firefox brute-forces through the inefficiency faster. Safari exposes the O(n²) behavior more clearly.
The Fix
The proper fix would be to only update checkboxes that actually need their disabled state changed:
async limitPins() {
  await Promise.resolve()
  const checkboxes = this.checkboxes
  const used = checkboxes.filter(el => el.checked).length
  const limit = parseInt(this.getAttribute('max')!, 10)

  for (const el of checkboxes) {
    const shouldDisable = used === limit && !el.checked
    // Only update if it needs to change
    if (el.disabled !== shouldDisable) {
      el.disabled = shouldDisable
    }
  }
  // ... rest
}
This would reduce the number of DOM mutations from 100+ to typically just a few. Most checkbox clicks don’t actually require any disabled state changes - only when you hit or leave the 6-item limit. By checking if the value needs to change first, you go from 100+ DOM mutations on every click to 0 mutations for most clicks, and ~94 mutations only when crossing the limit threshold.
Key Takeaways
- Browser differences matter - Performance issues may only manifest in certain browsers
- Safari Timelines is powerful - The visual breakdown of JavaScript, Layout, and Rendering clearly showed where time was spent
- Look at ALL the events - I initially missed the second, slower event handler
- Scale reveals bugs - This code probably works fine with 10 repos, but breaks down at 100+
- Check your assumptions - I thought it was React, turns out it was web components (Catalyst)
- Safari DevTools > Timelines tab - Visual breakdown of performance
- Console timing -
console.time()/console.timeEnd()for quick measurements - Network tab - Rule out backend issues
- Call stack inspection - Find the actual slow code
If you’re experiencing performance issues in your web apps, Safari’s Timelines tool is an excellent starting point for investigation. The visual breakdown makes it easy to see whether you’re blocked on JavaScript, layout, rendering, or network.