Python random.expovariate() Method
The random.expovariate() method in Python generates random numbers that follows the Exponential distribution. The exponential distribution is a continuous probability distribution commonly used to model the time between events in a Poisson process. It is characterized by a parameter lambda, which is the rate parameter.
The parameter lambda is 1.0 divided by the desired mean of the distribution. If lambda is positive, the function returns values from 0 to positive infinity, representing times between events. If lambda were negative, it would return values from negative infinity to 0.
Syntax
Following is the syntax of the expovariate() method −
random.expovariate(lambda)
Parameters
This method accepts a single parameter −
lambda: This is the rate parameter of the exponential distribution.
Return Value
This method returns random numbers that follows the exponential distribution with the specified rate.
Example 1
Let's see a basic example of using the random.expovariate() method for generating a single random number.
import random

# Lambda for the Exponential distribution
lambda_ = 2

# Generate a random number from the Exponential distribution
random_value = random.expovariate(lambda_)

print("Random value from Exponential distribution:", random_value)
Following is the output −
Random value from Exponential distribution: 0.895003194051671
Note: The Output generated will vary each time you run the program due to its random nature.
Example 2
This example generates 10 interval times with an average rate of 15 arrivals per second using the random.expovariate() method.
import random

# Lambda for the Exponential distribution
rate = 15  # 15 arrivals per second

# Generate a random numbers from the Exponential distribution
for i in range(10):
    interarrival_time = random.expovariate(rate)
    print(interarrival_time)
While executing the above code you will get the similar output like below −
0.05535939722671001
0.0365294773838789
0.0708190008748821
0.11920422853122664
0.014966394641357258
0.05936796131161308
0.09168815851495513
0.18426575850779056
0.03533591768827803
0.08367815594819812
Example 3
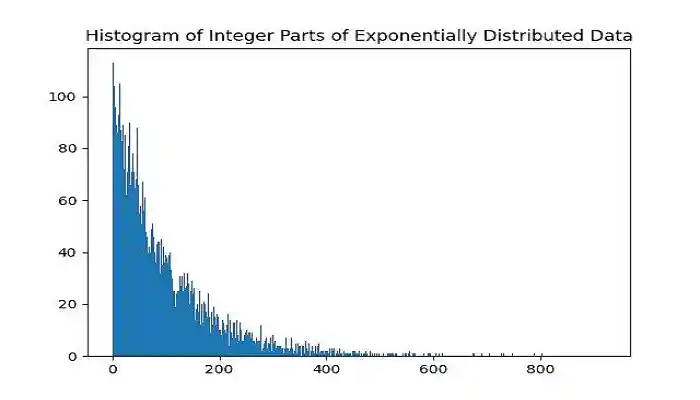
Here is another example that uses the random.expovariate() method to generate and display a histogram showing the frequency distribution of the integer parts of samples from an exponential distribution with a rate parameter of 100.
import random
import numpy as np
import matplotlib.pyplot as plt

# Generate 10000 samples from an exponential distribution with rate parameter of 100
rate = 1 / 100
num_samples = 10000

# Generate exponential data and convert to integers
d = [int(random.expovariate(rate)) for _ in range(num_samples)]

# Create a histogram of the data with bins from 0 to the maximum value in d
h, b = np.histogram(d, bins=np.arange(0, max(d)+1))

# Plot the histogram
plt.bar(b[:-1], h, width=1, edgecolor='none')
plt.title('Histogram of Integer Parts of Exponentially Distributed Data')
plt.show()
The output of the above code is as follows −
python_modules.htm