Python random.gauss() Method
The random.gauss() method in Python generates random numbers that follows the Gaussian Distribution, also called as Normal Distribution. It is a family of continuous probability distributions, depends on the values of two parameters mu and sigma. Where, mu is the mean and sigma is the standard deviation of the Gaussian distribution. This distribution is often used in statistics, data analysis, and various fields of science, including natural and social sciences.
This method is faster than the random.normalvariate() method for generating random numbers from a Gaussian (normal) distribution.
Syntax
Following is the syntax of the Python random.gauss() method −
random.gauss(mu, sigma)
Parameters
This method accepts the following parameters −
mu: This is the mean of the Gaussian distribution. It defines the center of the distribution around which the data points are distributed.
sigma: This is the standard deviation of the Gaussian distribution. It determines the spread of the distribution; a larger standard deviation results in a wider distribution.
Return Value
This method returns a random number that follows the Gaussian distribution.
Example 1
Let's see a basic example of using the Python random.gauss() method for generating a random number from a Gaussian distribution with a mean of 0 and a standard deviation of 1.
import random

# mean
mu = 0
# standard deviation
sigma = 1

# Generate a Gaussian-distributed random number
random_number = random.gauss(mu, sigma)

# Print the output
print("Generated random number from Gaussian-distribution:",random_number)
Following is the output −
Generated random number from Gaussian-distribution: 0.5822883447626581
Note: The output generated will vary each time you run the program due to its random nature.
Example 2
This example generates a list of 10 random numbers that follows the Gaussian distribution using the random.gauss() method.
import random

# mean
mu = -2

# standard deviation
sigma = 0.5

result = []
# Generate a list of random numbers from the Gaussian distribution
for i in range(10):
    result.append(random.gauss(mu, sigma))

print("List of random numbers from Gaussian distribution:", result)
While executing the above code you will get the similar output like below −
List of random numbers from Gaussian distribution: [-1.6883491787714924, -2.2670950449189835, -1.68497316636885, -2.62956757323328, -1.8888429377204585, -2.6139116413700765, -2.287545626016553, -1.5470101615690448, -2.259090829777413, -1.9380772732164955]
Example 3
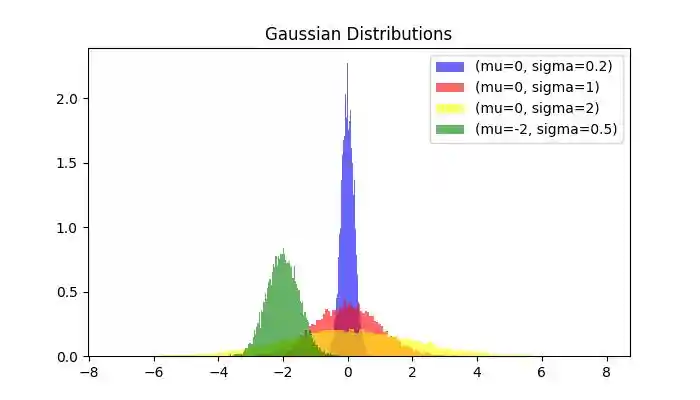
Here is another example that uses the random.gauss() method, and demonstrates how changing the mean and standard deviation affects the shape of the Gaussian distribution.
import random
import matplotlib.pyplot as plt

# Define a function to generate and plot data for a given mu and sigma
def plot_gaussian(mu, sigma, label, color):

    # Generate Gaussian-distributed data
    data = [random.gauss(mu, sigma) for _ in range(10000)]

    # Plot histogram of the generated data
    plt.hist(data, bins=100, density=True, alpha=0.6, color=color, label=f'(mu={mu}, sigma={sigma})')

fig = plt.figure(figsize=(7, 4))

# Plotting for each set of parameters
plot_gaussian(0, 0.2, '0, 0.2', 'blue')
plot_gaussian(0, 1, '0, 1', 'red')
plot_gaussian(0, 2, '0, 2', 'yellow')
plot_gaussian(-2, 0.5, '-2, 0.5', 'green')

# Adding labels and title
plt.title('Gaussian Distributions')
plt.legend()

# Show plot
plt.show()
The output of the above code is as follows −
python_modules.htm