Python Pandas - Hexagonal Bin Plot
Hexagonal bin plot, also known as hexbin plot, is an alternative to scatter plots, especially when the data is too dense to visualize individual points. Instead of plotting each data point, the hexagonal bin plot divides the plane into hexagons and aggregates data within each hexagon.
The Pandas library provides the DataFrame.plot.hexbin() method for creating the hexagonal bin plot. In this tutorial, we will learn about how to use the Pandas DataFrame.plot.hexbin() method for creating and customizing hexagonal bin plot with different examples.
Hexagonal Bin Plot in Pandas
By using the DataFrame.plot.hexbin() method, you can create a hexagonal bin plot for x versus y data. Resulting a Matplotlib Axes on which the hexagonal bin plot is rendered.
Syntax
Following is the syntax of the plot.hexbin() method −
DataFrame.plot.hexbin(x, y, C=None, reduce_C_function=None, gridsize=None, **kwargs)
Where,
x: The column label or position for x-axis values.
y: The column label or position for y-axis values.
C: An Optional parameter specifies the column label or position for the value at each (x, y) point. Defaults to None.
reduce_C_function: An aggregate function to reduce bin values into a single number (e.g., np.mean, np.max, np.sum, etc.).
gridsize: Specifies the number of hexagons in the x-direction. Alternatively, a tuple can specify the number of hexagons in both x and y directions.
**kwargs: Additional keyword arguments to customize the plot.
Example
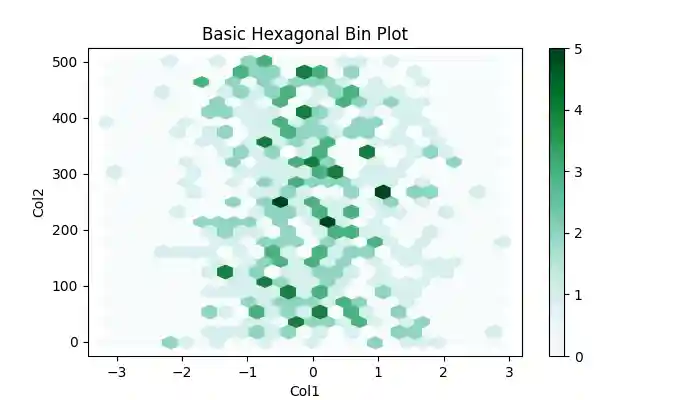
Let's create a basic hexagonal bin plot using the DataFrame.plot.hexbin() method.
import pandas as pd
import numpy as np
import matplotlib.pyplot as plt

# Generate sample data
df = pd.DataFrame(np.random.randn(500, 2), columns=["Col1", "Col2"])
df["Col2"] = df["Col2"] + np.arange(500)

# Create a hexagonal bin plot
df.plot.hexbin(x="Col1", y="Col2", gridsize=25)

# Set title and Display the plot
plt.title('Basic Hexagonal Bin Plot')
plt.show()
Following is the output of the above code −
Applying Aggregation to the Hexbin Plot
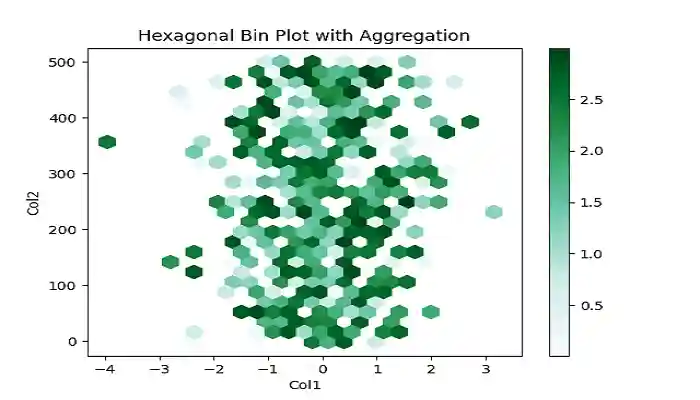
You can apply additional data aggregation function to reduce bin values into a single number using the C and reduce_C_function parameters. The parameter C specifies the values at each (x, y) points, and the reduce_C_function parameter takes a function to aggregate values in each bin to a single number.
Example
The following example demonstrates creating a hexagonal bin plot with an additional aggregation function using the C and reduce_C_function parameters.
import pandas as pd
import numpy as np
import matplotlib.pyplot as plt

# Generate sample data
df = pd.DataFrame(np.random.randn(500, 2), columns=["Col1", "Col2"])
df["Col2"] = df["Col2"] + np.arange(500)

# Add a value column
df["Col3"] = np.random.uniform(0, 3, 500)

# Create a hexagonal bin plot with aggregation
df.plot.hexbin(x="Col1", y="Col2", C="Col3", reduce_C_function=np.max, gridsize=25)

# Set title and Display the plot
plt.title('Hexagonal Bin Plot with Aggregation')
plt.show()
On executing the above code we will get the following output −
Customizing Hexagonal Bin Plots
You can enhance the visual appeal the hexagonal bin plots by customizing parameters like colormap, transparency, edgecolors, and more.
Example
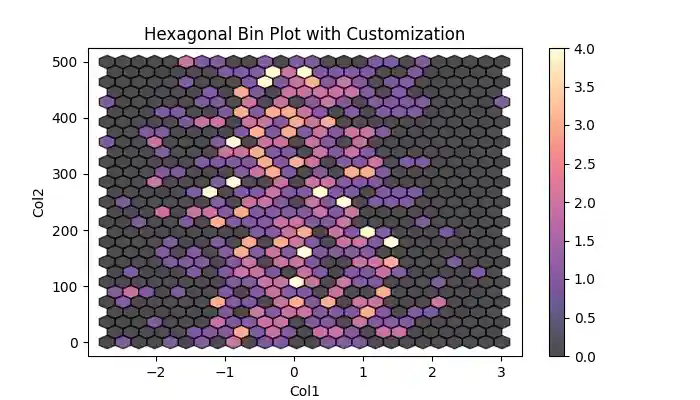
The following example demonstrates customizing the hexagonal bin plot using the colormap, transparency, and edgecolors parameters.
import pandas as pd
import numpy as np
import matplotlib.pyplot as plt

# Generate sample data
df = pd.DataFrame(np.random.randn(500, 2), columns=["Col1", "Col2"])
df["Col2"] = df["Col2"] + np.arange(500)

# Add a value column
df["Col3"] = np.random.uniform(0, 3, 500)

# Create a hexagonal bin plot with customizations
df.plot.hexbin(x="Col1", y="Col2", gridsize=25, cmap='magma', edgecolors="black", alpha=0.7)

# Set title and Display the plot
plt.title('Hexagonal Bin Plot with Customization')
plt.show()
After executing the above code, we get the following output −