SegReg free calculator for segmented piecewise regression in splines with breakpoint
|
Summary: The SegReg computer program (model) is designed to perform a segmented (piecewise) linear regression (in splines) of one dependent (response) variable )Y, e.g. plant growth, crop yield) on one (X) or two (X and Z) independent (explanatory, causal, ifluential) variables (predictors), e.g. crop growth factors like depth of water table and soil salinity. It can also be condidered as a regression calculator. |
|
Details: The segmentation is done by introducing a breakpoint (break-point, threshold, switching point). Thus one can obtain a broken, discontinuous, line. Seven types of functions (0 to 6) are used. Examples are given below. The selection of the best function type and breakpoint is based on maximizing the statistical coefficient of explanation (determination) and performing the test of significance. The 90% confidence interval (belt) is given as well as an Anova table for variance analysis. In December 2008, an amplified version of the SegReg calculator (SegRegA) was made permitting the use of weight factors, preferred regression type or type exclusion. Although it can lead to manipulation, it is available on request. More details are found in the program itself. |
|
Start: The mathematical model starts clicking on SegReg.Exe. |
|
Documentation:
A paper on the statistical principles of
segmented regression with break-point,
including the determination of its confidence
interval, can be inspected
in here. |
|
Acknowledgements In September 2010, the SegReg program calculator was provided with new functionalities thanks to a request by Kirsten Otis so that the model permits extra applications. In March 2011 the confidence belts were improved thanks to questions raised by Linda Jung. In October 2012 the confidence block of the breakpoint for type 2 functions was improved thanks to questions raised by John Schukman. In March 2013 the use of a second independent variable was updated thanks to comments made by Barbara Mahler. In November 2013 the calculation of the standard error and confidence interval of the breakpoint (BP), as well as of the Y value at BP, was standardized for the different types of segmented regression. A description of the mathematics involved, with examples, can be seen in this confidence paper. These changes were motivated by suggestions put forward by Dawn Noren and Wenhuai Li. In January 2014 the conditions for Type 2, 3, 4 and 5 were made more strict thanks to an example provided by John Shukman. |
|
Experiences:
For improvement, I am interested to learn about
your experiences with SegReg. For this, there
is a contact form. |
Download:
SegReg
standard
Download:
SegRegA
amplified
Software
& models
General articles
& manuals
Artículos
(in Spanish,
en Español)
Published
reports & cases
Particular
reports & cases
FAQ's
& answers
Home
page
(1) - An amplification application of the SegReg
calculator permitting expression of
preference for a certain type of
segmentation, or of the wish to exclude a
certain type, can be downloaded from
SegRegA.
It also gives the option to select an S-curve,
power function, or a generalized third degree
polynoom, see:
S-curves,
Cubic,
Power or,
Polynome.
(2) - A different version of SegReg, called
PartReg
has been developed with the aim to detect the
largest possible horizontal stretch (plateau)
in Type 3 and Type 4 relations. This has been
done to find the maximum tolerance (plateau or
"no effect" reach) of the dependent variable -
e.g. crop yield - for changes in the dependent
variable (e.g. soil salinity or depth of the
water table).
Download PartReg with
this link
See the figures below to appreciate the
difference between SegReg and PartReg. The
first minimizes the deviations of the model
values from the observed ones over the entire
domain, whereas the second calculates the
maximum part (range) of the domain over
which the regression coefficient (i.e. the
slope of the regression line) can be
taken equal to zero.
See also
For more examples see this
segmented regression
article on page 13 and following, the
tolerance paper on
soil salinity tolerance of crops, or the
sensitivity paper on
sensitivity of crops to shallow watertables.
Segreg permits the
analysis of one dependent and two independent
variables.
This case is called polynomial. See the screen
print of the input menu for such a case in
Part 2 of the illustrations below. Some
results are also shown there.
Relations of crop yield and depth of water
table:
crop-watertable .
Yearly average day temperatures in the
Netherlands and global warming:
average
temperatures .
Yearly maximum day temperatures in the
Netherlands and global warming:
maximum
temperatures .
Segmented and probability analysis:
segments and probability.
Comparing the regressions of Y-X data by means
of the amplified power function using Solver
in Excel and SegRegA with
graphics.
Testing the statistical significance of the
improvement of cubic regression compared to
quadratic regression using analysis of
variance (ANOVA):
testing.
(Part 2 for the polynomal case of 1 dependent variable (Y) and 2 independent variables (X and Z) can be seen further down) Introduction screen of SegReg calculator program:
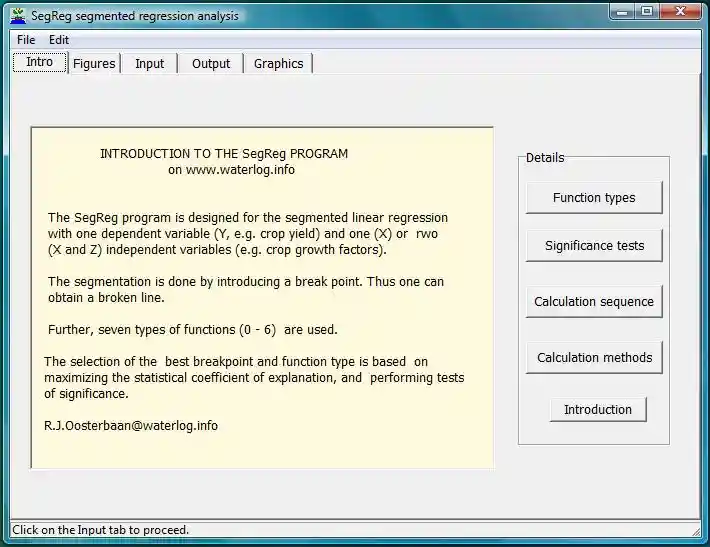
The model comes with various explanations like programmed function types, calculation methods, and application of significance tests.
Example Type 3:
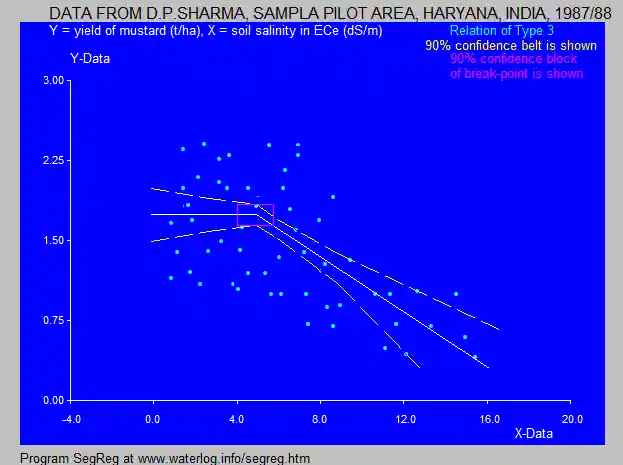
The calculator clarifies the crop response and demonstrates the resistance to high soil salinity or water level. This Type 3 is similar to the Maas-Hoffman model having a plateau.
Example Type 3 with extended horizontal line (plateau)
using the same data as above in the
PartReg software
application instead of SegReg.

According to this calculator model, the salt
tolerance of mustard is almost ECe=8 dS/m.
After this threshold (breakpoint, knot)the yield
reduces.
In other words, from this application program it
can be deduced that the crop resists salinity
up to 8 dS/m while up to 8 dS/m there is no
negative effect.
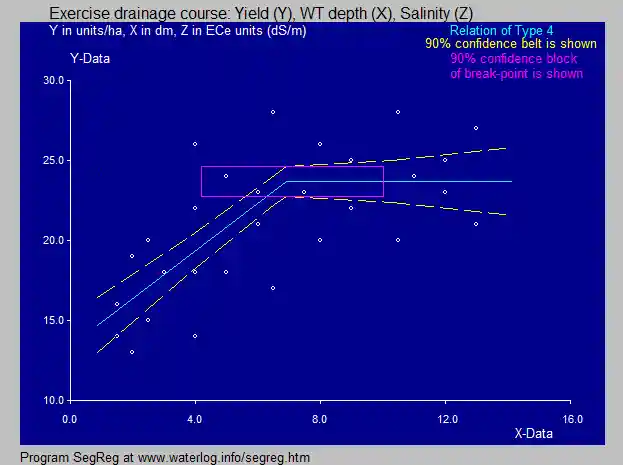
Example Type 4:
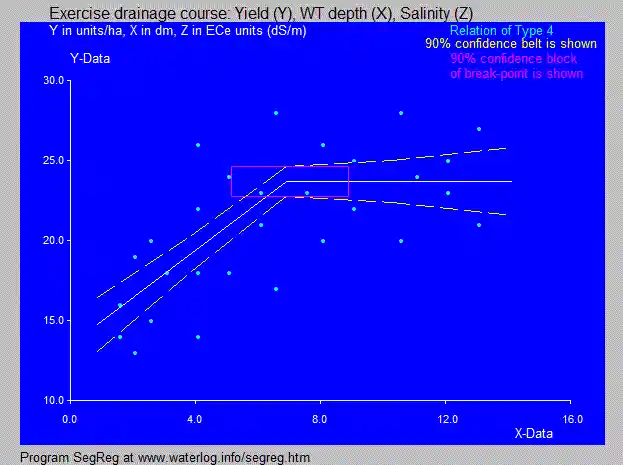
The crop tolerates a depth of the water table of 7 dm.
The Segreg software calculator is an application (app) made to detect different segmented models, like Type 4 with a plateau in the above figure.
This type is an inverted Type 3 or an inverted Maas-Hoffman model. The breakpoint is also called knot.
Example Type 5:
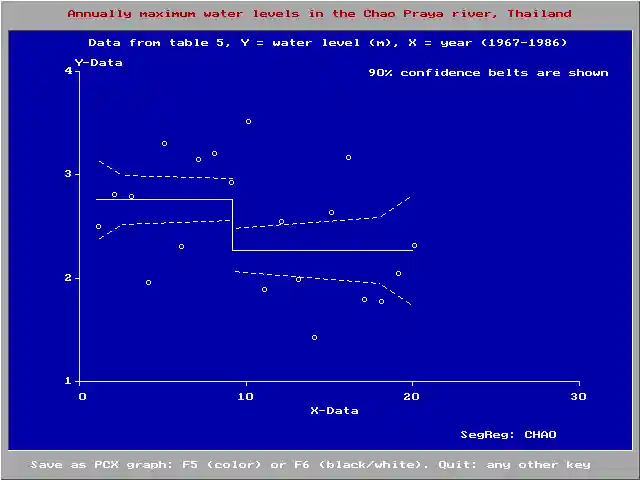
In year 9 (1976) a dam was contstructed in the
river
The Segreg application (app) is a calculator made
to program different segmented models, for example
Type 5 in the figure.
Part 2 for the polynomal case of 1 dependent variable (Y) and 2 independent variables (X and Z)
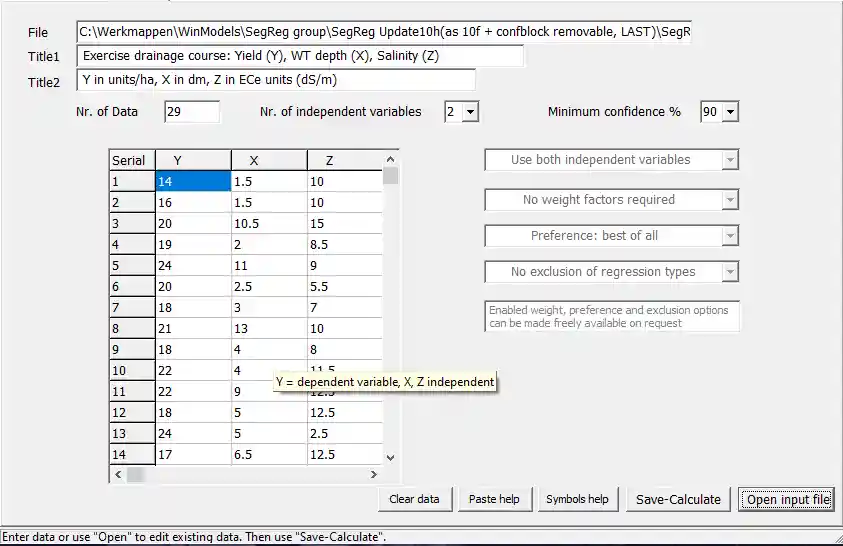
Screen print of the input menu for the polynomial
case (1 dependent variable (Y) and 2 independent
variables (X and Z).
The SegReg program found that the 1st independent
variable (X) has a higher coefficient of
explanation than the second (Z). Therefore the first
segemented regression is made for X.
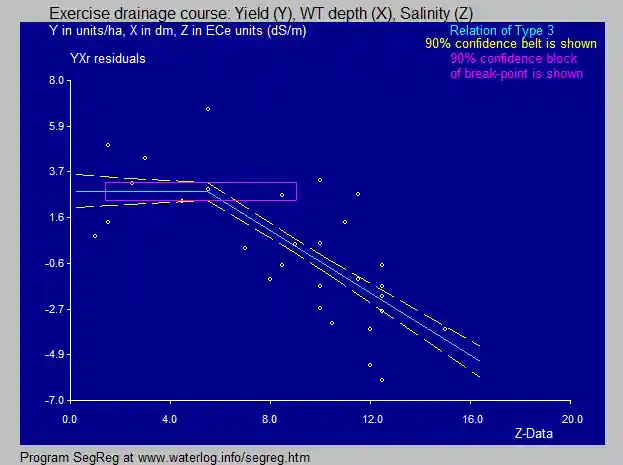
The the residuals of Y after the regression on X
are used with a segmented regression on the second
variable (Z).
The mathematical combination
of the first and second analysis yields equations
of the type
Y = A.X + B.Z + C (polynomial)