Home
Features
Source code inspection for all stack frames (with highlighting)
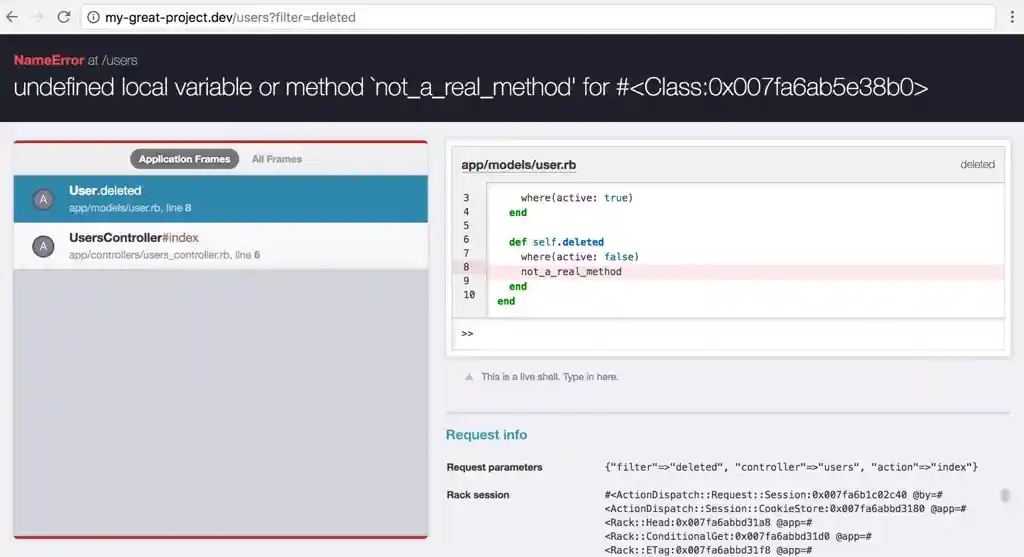
When an exception occurs, the Better Errors console is displayed. It shows the stack trace frames that are within the application, if there are any.
The stack trace frames are visible at the left, and the currently-selected frame is inspected on the right.
The lines of source code are shown syntax-highlighted.
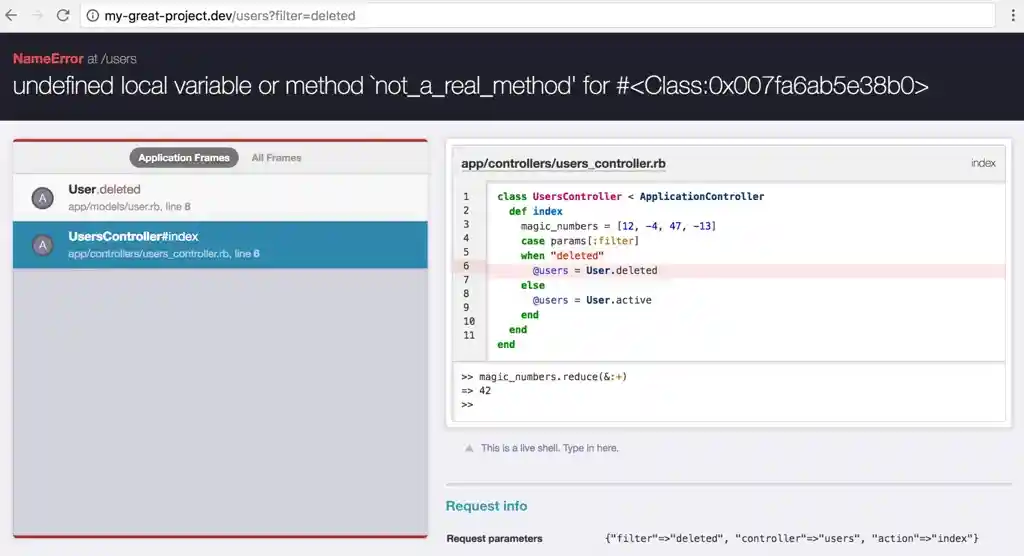
Full stack trace
By choosing a different frame on the left, you can inspect the state of the code at each level of execution.
You can switch between seeing only the frames within your application, and seeing all frames including those in external gems or libraries.

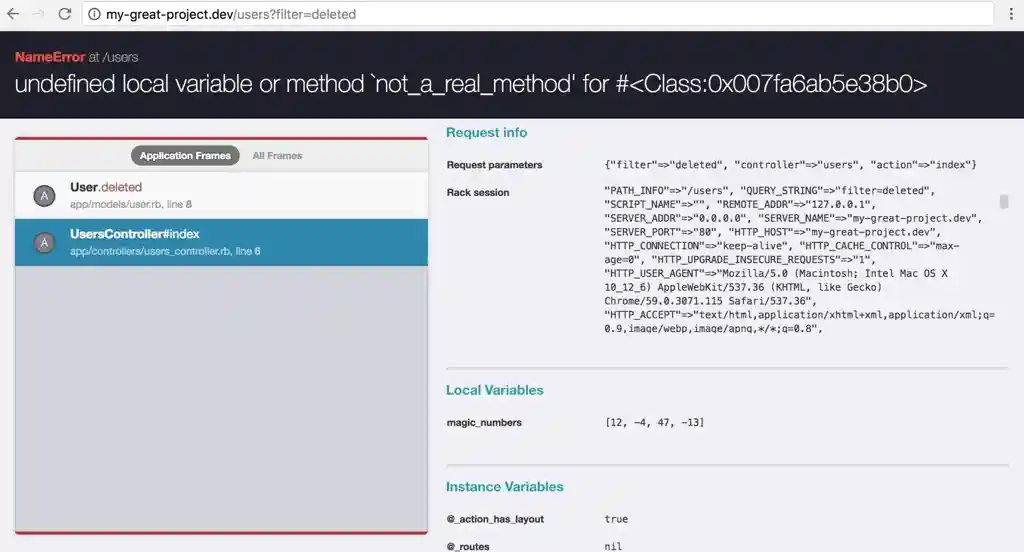
Local and instance variable inspection
By scrolling down on the right side, you can see all local variables that exist in the selected frame.
In addition to local variables, session and request variables are listed.
Live shell (REPL) on every stack frame
You can inspect any variable and call methods available in the chosen frame.
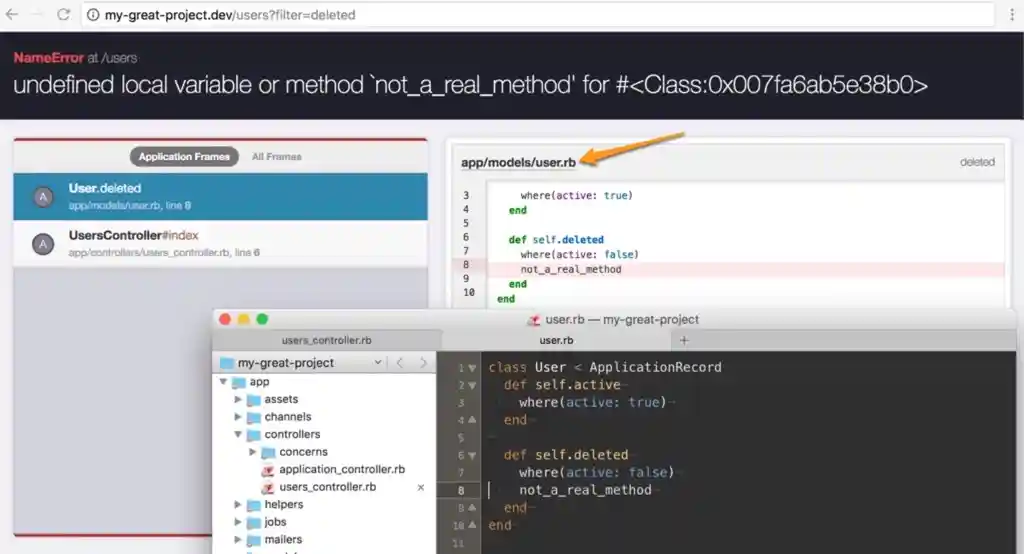
Links directly to the source line in your editor
At the top of the source code displayed, there is a link directly to the given file, which will open in your editor, even to the specific line.
Useful information in non-HTML requests
If an exception is raised during a non-HTML request, for example using curl, the exception is returned as text.
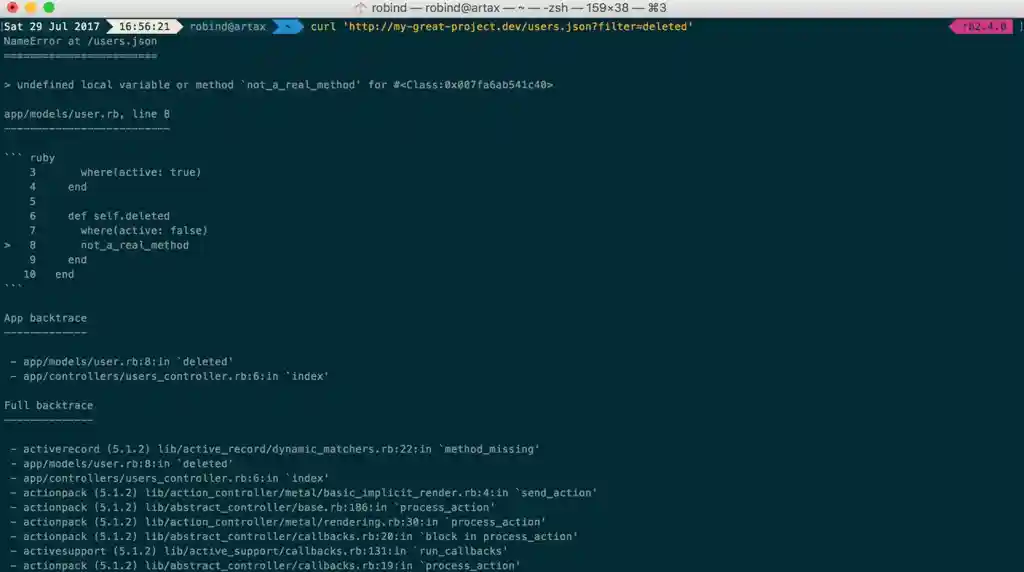

You can then open the manual console to inspect and work with the most recent exception.
