Debugging
This page has moved to docs.servicestack.net/debugging
Debugging Source Symbols in NuGet packages
It's possible to debug into the ServiceStack source code when using the ServiceStack NuGet packages. You can enable this after enabling SymbolSource integration in VisualStudio:
- Go to
Tools -> Options -> Debugger -> General - Uncheck Enable Just My Code, Enable .NET Framework source stepping and Require source files to exactly match the original version
- Check Enable source server support
- In the
Tools -> Options -> Debugger -> Symbolsdialog, under the Symbol file (.pdb) locations section by clicking the New Folder icon and add the following urls (in order): - http://referencesource.microsoft.com/symbols - https://nuget.smbsrc.net - http://msdl.microsoft.com/download/symbols
And with that you should now be able to debug into the source code of any NuGet package (who publishes their Symbols) directly from within your application!
Configuration
DebugMode
ServiceStack allows additional debug information when in DebugMode, which is automatically set by default in Debug builds or explicitly with:
SetConfig(new HostConfig { DebugMode = true });
In addition, users with the Admin role or Requests with an AuthSecret can also view Debug Info in production.
Admin Role
Users in the Admin role have super-user access giving them access to any services or plugins protected with Roles and Permissions.
AuthSecret
You can use Config.AdminAuthSecret to specify a special string to give you admin access without having to login by adding ?authsecret=xxx to the query string, e.g:
SetConfig(new HostConfig { AdminAuthSecret = "secretz" });
By-pass protected services using query string:
/my-service?authsecret=secretz
Debug Links
To provide better visibility to the hidden functionality in ServiceStack we've added Debug Info links section to the /metadata page which add links to any Plugins with Web UI's, e.g:

The Debug Links section is only available in DebugMode.
You can add links to your own Plugins in the metadata pages with:
appHost.GetPlugin<MetadataFeature>()
    .AddPluginLink("swagger-ui/", "Swagger UI");

appHost.GetPlugin<MetadataFeature>()
    .AddDebugLink("?debug=requestinfo", "Request Info");
AddPluginLink adds links under the Plugin Links section and should be used if your plugin is publicly visible, otherwise use AddDebugLink for plugins only available during debugging or development.
Plugins
There are a number of plugins that can help with debugging:
Request Info
Provides ServiceStack's Request Info feature useful for debugging requests. Just add ?debug=requestinfo in your /pathinfo and ServiceStack will return a dump of all the HTTP Request parameters to help with with debugging interoperability issues. The RequestInfoFeature is only enabled in DebugMode.
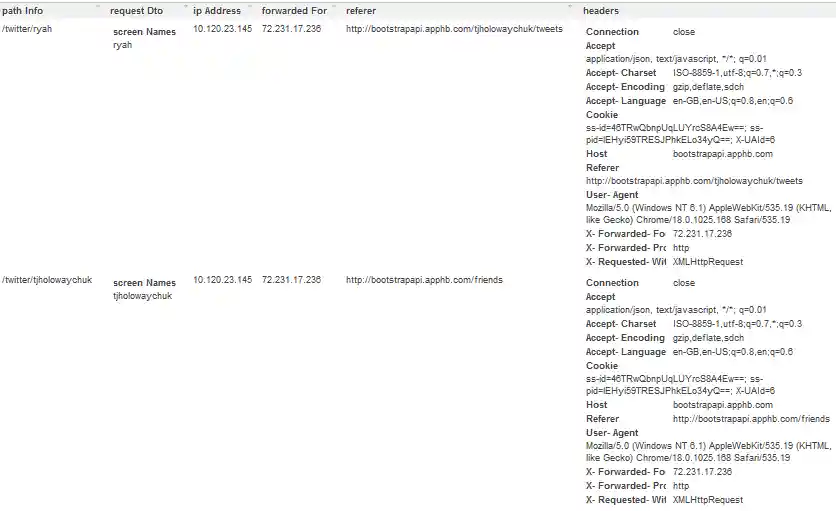
Request Logger
Add an In-Memory IRequestLogger and service with the default route at /requestlogs which maintains a live log of the most recent requests (and their responses). Supports multiple config options incl. Rolling-size capacity, error and session tracking, hidden request bodies for sensitive services, etc.
Plugins.Add(new RequestLogsFeature());
The IRequestLogger is a great way to introspect and analyze your service requests in real-time. Here's a screenshot from the http://bootstrapapi.servicestack.net website:
It supports multiple queryString filters and switches so you filter out related requests for better analysis and debuggability:
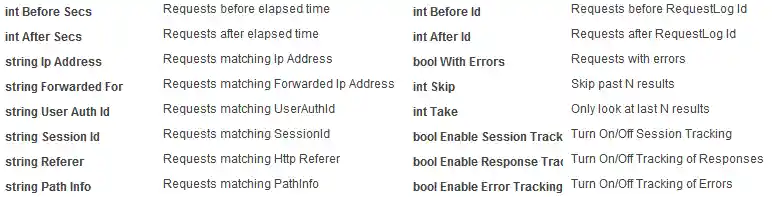
The RequestLogsService is just a simple C# service under-the-hood but is a good example of how a little bit of code can provide a lot of value in ServiceStack's by leveraging its generic, built-in features.