Example Charts
- Area Range – display range of values
- Boxplot - summarize distributions of data
- Bubble Scatterplot - display relationships between a number of dimensions on a measure
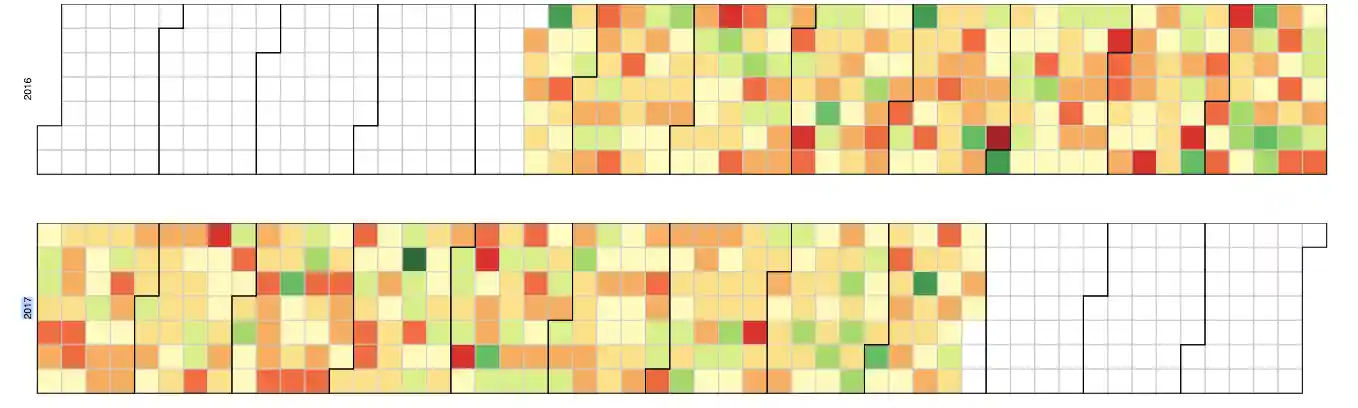
- Calendar - display a heatmap of daily data
- Chord - display relationships between two dimensions
- Collapsible Tree - visualize a hierarchy
- Heatmap - two dimensional display of tabular data highlighting correlations
- Histogram - visualize distributions
- Matrix - a reorderable heatmap visualization for a matrix
- Sankey - display sequences of transitions
- Spiderweb - compare measures across multiple of dimensions
- Sunburst - display hierarchical data in a nested structure
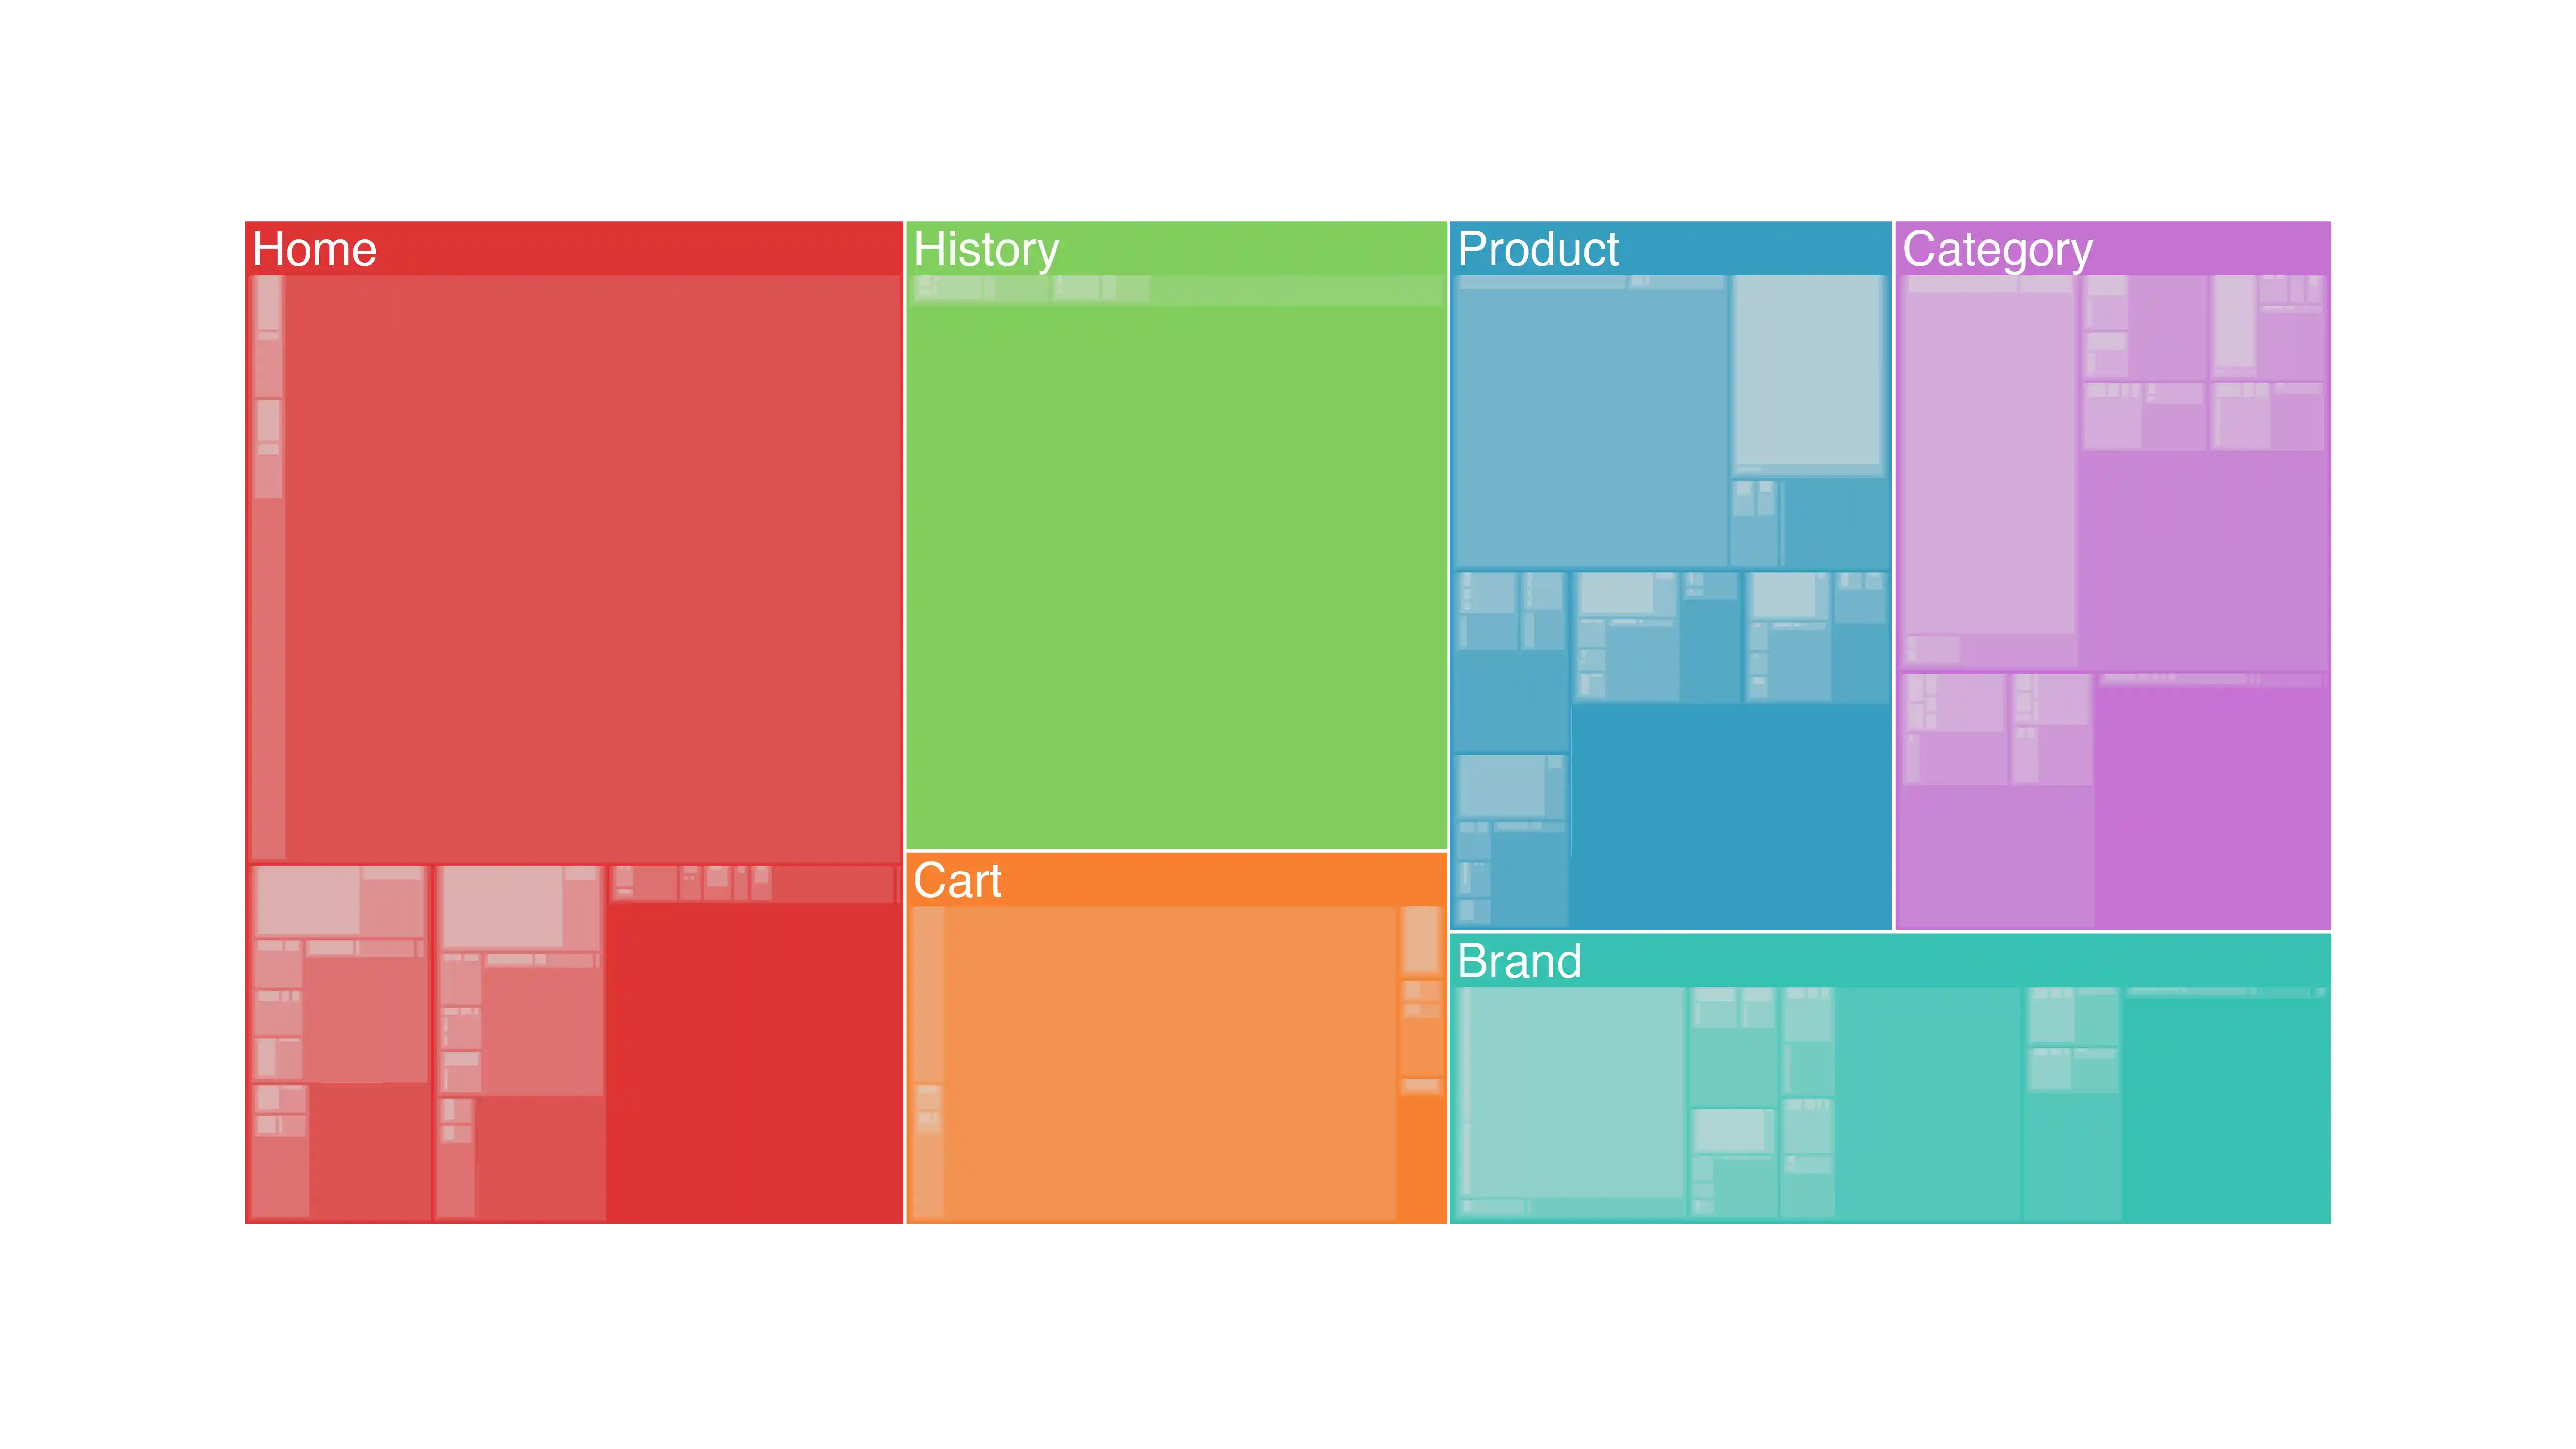
- Treemap - hierarchical display of a measure
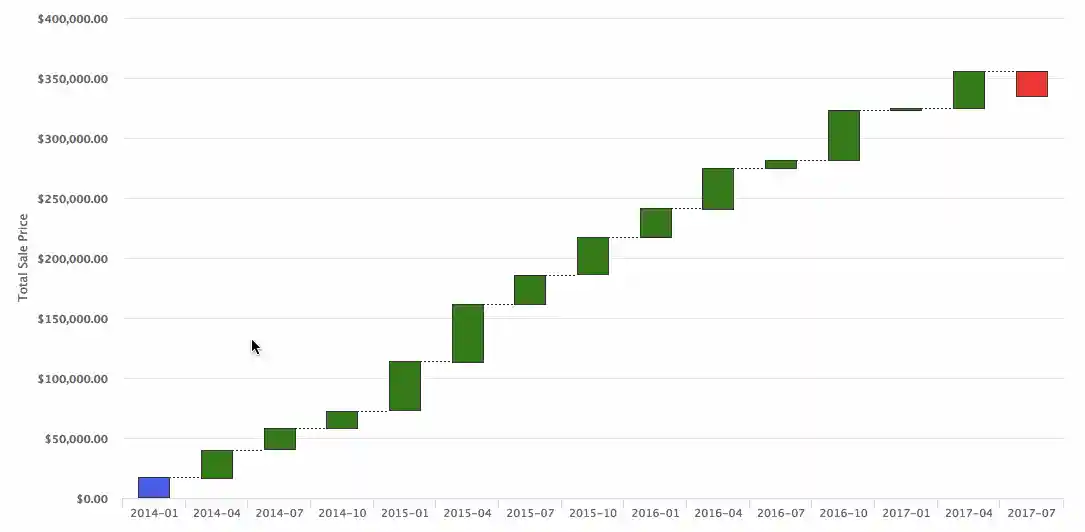
- Waterfall - cumulative effect of sequential deltas
Area Range

Boxplot

Bubble Scatterplot

Calendar
Chord

Collapsible Tree

Heatmap

Histogram

Matrix

Sankey

Spiderweb

Sunburst

Treemap

Waterfall