The maptalks.table.js plug-in is mainly used to create a table on the map container, which contains two types, respectively, custom tables and dynamic tables, The former manual editing data, the latter data is bound to a layer.
Feature
- Add interactive table for maps.
- Output table screenshot through "map.toDataURL()".
- Support drag and mouse event listener.
Installing
<script src="dist/maptalks.table.min.js">
or
npm install maptalks-table
Demo
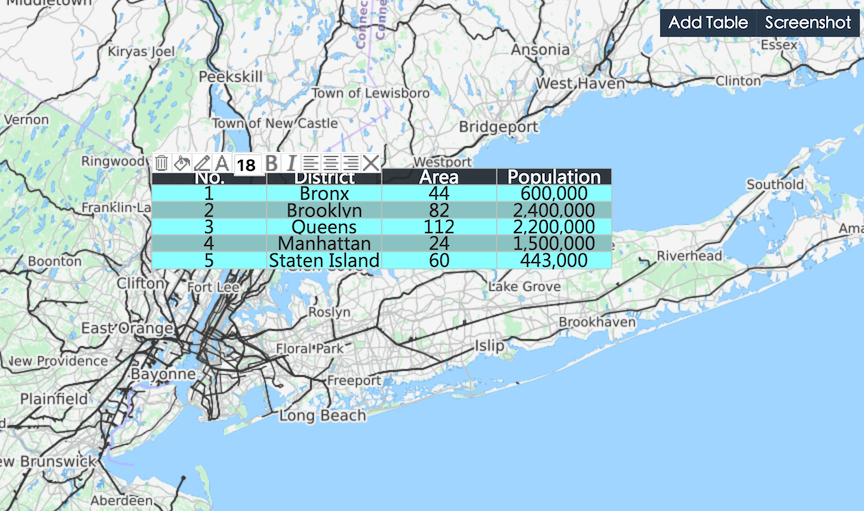
Table Class
API
new maptalks.Table(options);
var myTalbe = new maptalks.Table({
    'title': 'title',
    'columns': [
        {header:'Name', dataIndex: 'name', type: 'string'},
        {header:'Birth', dataIndex: 'birth', type: 'data'},
        {header:'Age', dataIndex: 'age', type: 'number'},
        {header:'Marry', dataIndex: 'marry', type: 'boolean', trueText:'Yes', falseText: 'No'}
    ],
    'data': [
        {name:'Tom', birth:'1990-1-1', age: 25, marry: 'true'},
        {name:'Peter', birth:'1985-5-1', age: 30, marry: 'true'},
        {name:'Mary', birth:'2000-6-1', age: 15, marry: 'false'}
    ],
    'headerSymbol' :{
        'lineColor': '#ffffff',
        'fill': '#4e98dd',
        'textFaceName': 'monospace',
        'textSize': 12,
        'textFill': '#ebf2f9',
        'textWrapWidth': 100
    },
    'symbol': {
        'lineColor': '#ffffff',
        'fill': '#4e98dd',
        'textFaceName': 'monospace',
        'textSize': 12,
        'textFill': '#ebf2f9',
        'textWrapWidth': 100
    },
    'position': {
        'x': 121.489935,
        'y': 31.24432
    },
    'width': 300,
    'height': 300,
    'draggable': true,
    'editable': true,
    'header': true,
    'order': true,
    'startNum' : 1,
    'dynamic': false,
    'layerId' : null
});
Create table.
toJSON()
Convert table object to JSON string.
initByJson(jsonStr)
myTable.initByJson(jsonStr);
Initialize table from JSON string.
addTo(layer)
Add table to maptalks's layer.
hide()
Hide table.
show()
Display table.
remove()
Remove table from layer.
setCoordinates(coordiante)
myTable.setCoordinates({
    'x': 121.489935,
    'y': 31.24432
});
Setting the position where table display.
setStartNum(num)
Setting table start number。
animate(style, options, callback)
myTable.animate(style, options, callback);
Setting table animate show or hide effect.
getMap()
Get this map which table add to.
getLayer()
Get this layer which table add to.
getCenter()
Get table coordinate.
setTableStyle(attr, value, isGlobal)
myTable.setTableStyle('markerFill', '#00ff00', true);
Change table style.
addRow(rowNum, data, below)
myTable.addRow(1, {name:'Tom', birth:'1990-1-1', age: 25, marry: 'true'}, true);
Add new row.
updateRow(rowNum, data)
myTable.addRow(1, {name:'Tom', birth:'1990-1-1', age: 25, marry: 'true'});
Update row.
removeRow(rowNum)
Remove row.
moveRow(rowNum, direction)
myTable.addRow(1, 'down');
Move row up or down.
addCol(colNum, data, right)
myTable.addCol(1, {header:'Name', dataIndex: 'name', type: 'string'}, true);
Add new column.
removeCol(colNum)
Remove column.
moveCol(colnum, direction)
myTable.moveCol(1, 'left');
Move column left or right.
Events
mouseover mouseout mousedown click dblclick contextmenu hide remove dragstart dragend moving dragging symbolchange edittextstart edittextend orderchanged
myTable.on('click', function(){alert('Your click table')});
Monitor table events for event handling.