Plot standard ECG chart from data.
- Support both direct plotting and plotting SVG preview in browser (currently only works on mac)
- Support saving PNG and SVG to disk
- Support customer defined lead order
- Support customer defined column count
Install
Notice
- Input data should be m x n matrix, which m is lead count of ECG and n is length of single lead signal.
- Default sample rate is 500 Hz.
Example
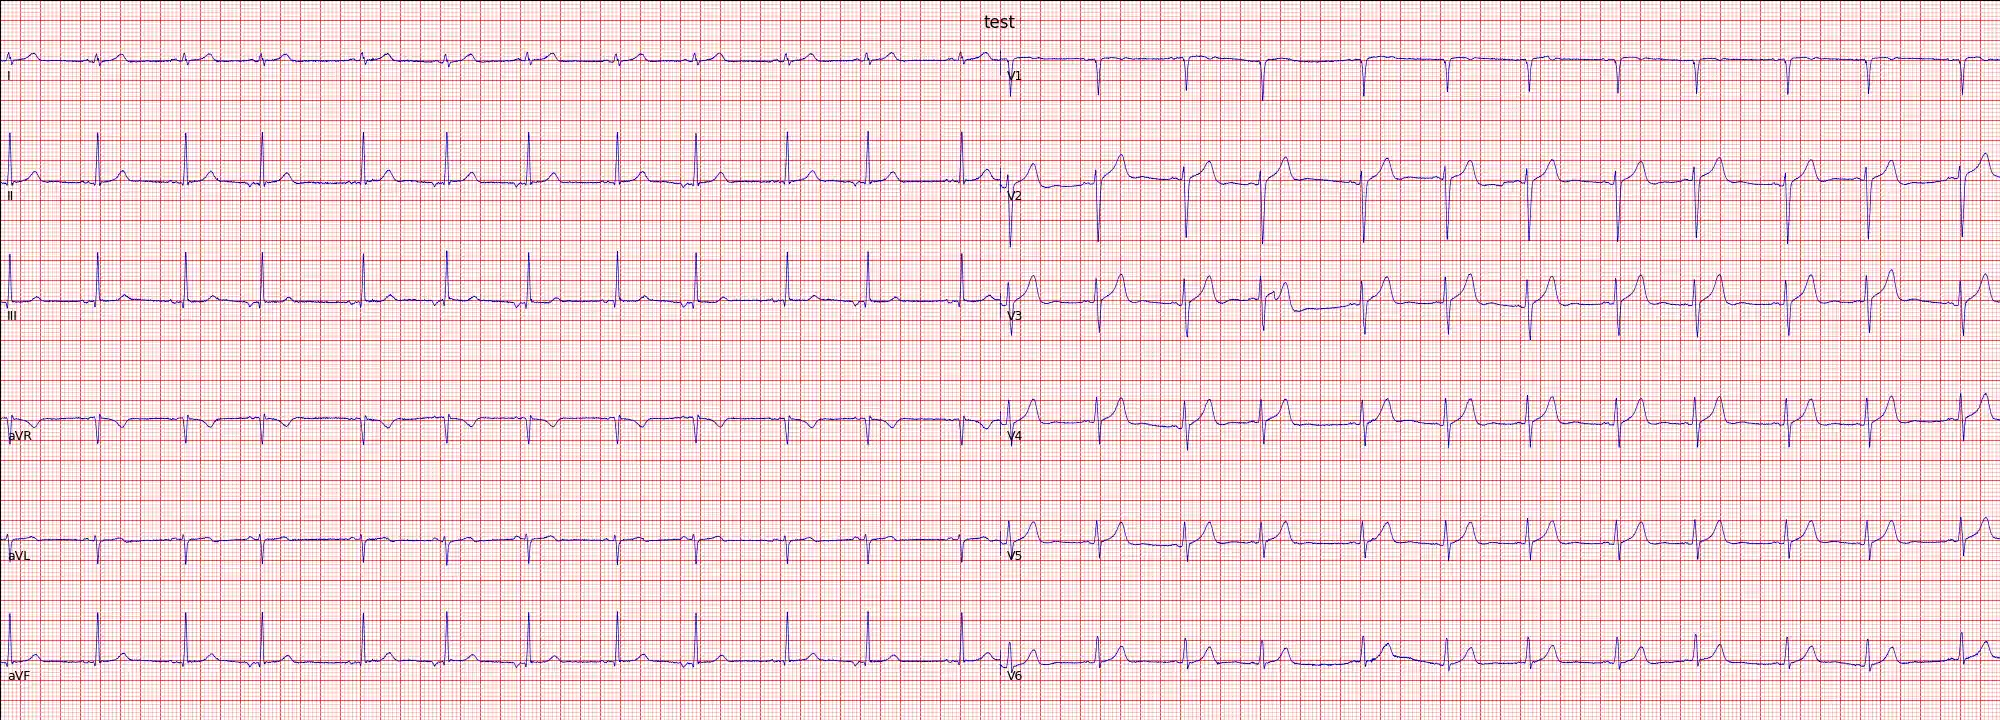
Plot 12 lead ECG
import ecg_plot

ecg = load_data() # load data should be implemented by yourself
ecg_plot.plot_12(ecg, sample_rate = 500, title = 'ECG 12')
ecg_plot.show()
Plot single lead ECG
import ecg_plot

ecg = load_data() # load data should be implemented by yourself
ecg_plot.plot_1(ecg[1], sample_rate=500, title = 'ECG')
ecg_plot.show()
Save result as png
import ecg_plot

ecg = load_data() # load data should be implemented by yourself
ecg_plot.plot_12(ecg, sample_rate = 500, title = 'ECG 12')
ecg_plot.save_as_png('example_ecg','tmp/')
License: MIT
