Reproducible code for the results shown in our manuscript Multiscale Comparative Connectomics (MCC):
Vivek Gopalakrishnan, Jaewon Chung, Eric Bridgeford, Benjamin D. Pedigo, Jesús Arroyo, Lucy Upchurch, G. Allan Johnson, Nian Wang, Youngser Park, Carey E. Priebe, and Joshua T. Vogelstein. “Multiscale Comparative Connectomics”. Imaging Neuroscience (2025).
Click any link for individual instructions on how to generate that specific figure.
Alternatively, execute the file code/run to generate all figures at once.
Figure 1: Overview of the statistical framework for multiscale comparative connectomics.
Figure 2: Average connectomes for each mouse strain with hierarchical structure labels.
Figure 3: Vertex embeddings of the corpus callosum obtained by the omnibus embedding.
Figure 4: Tractograms of the strongest signal edge, vertex, and community.
Figure 5: Whole-brain embeddings of all mouse connectomes in a low-dimensional space.
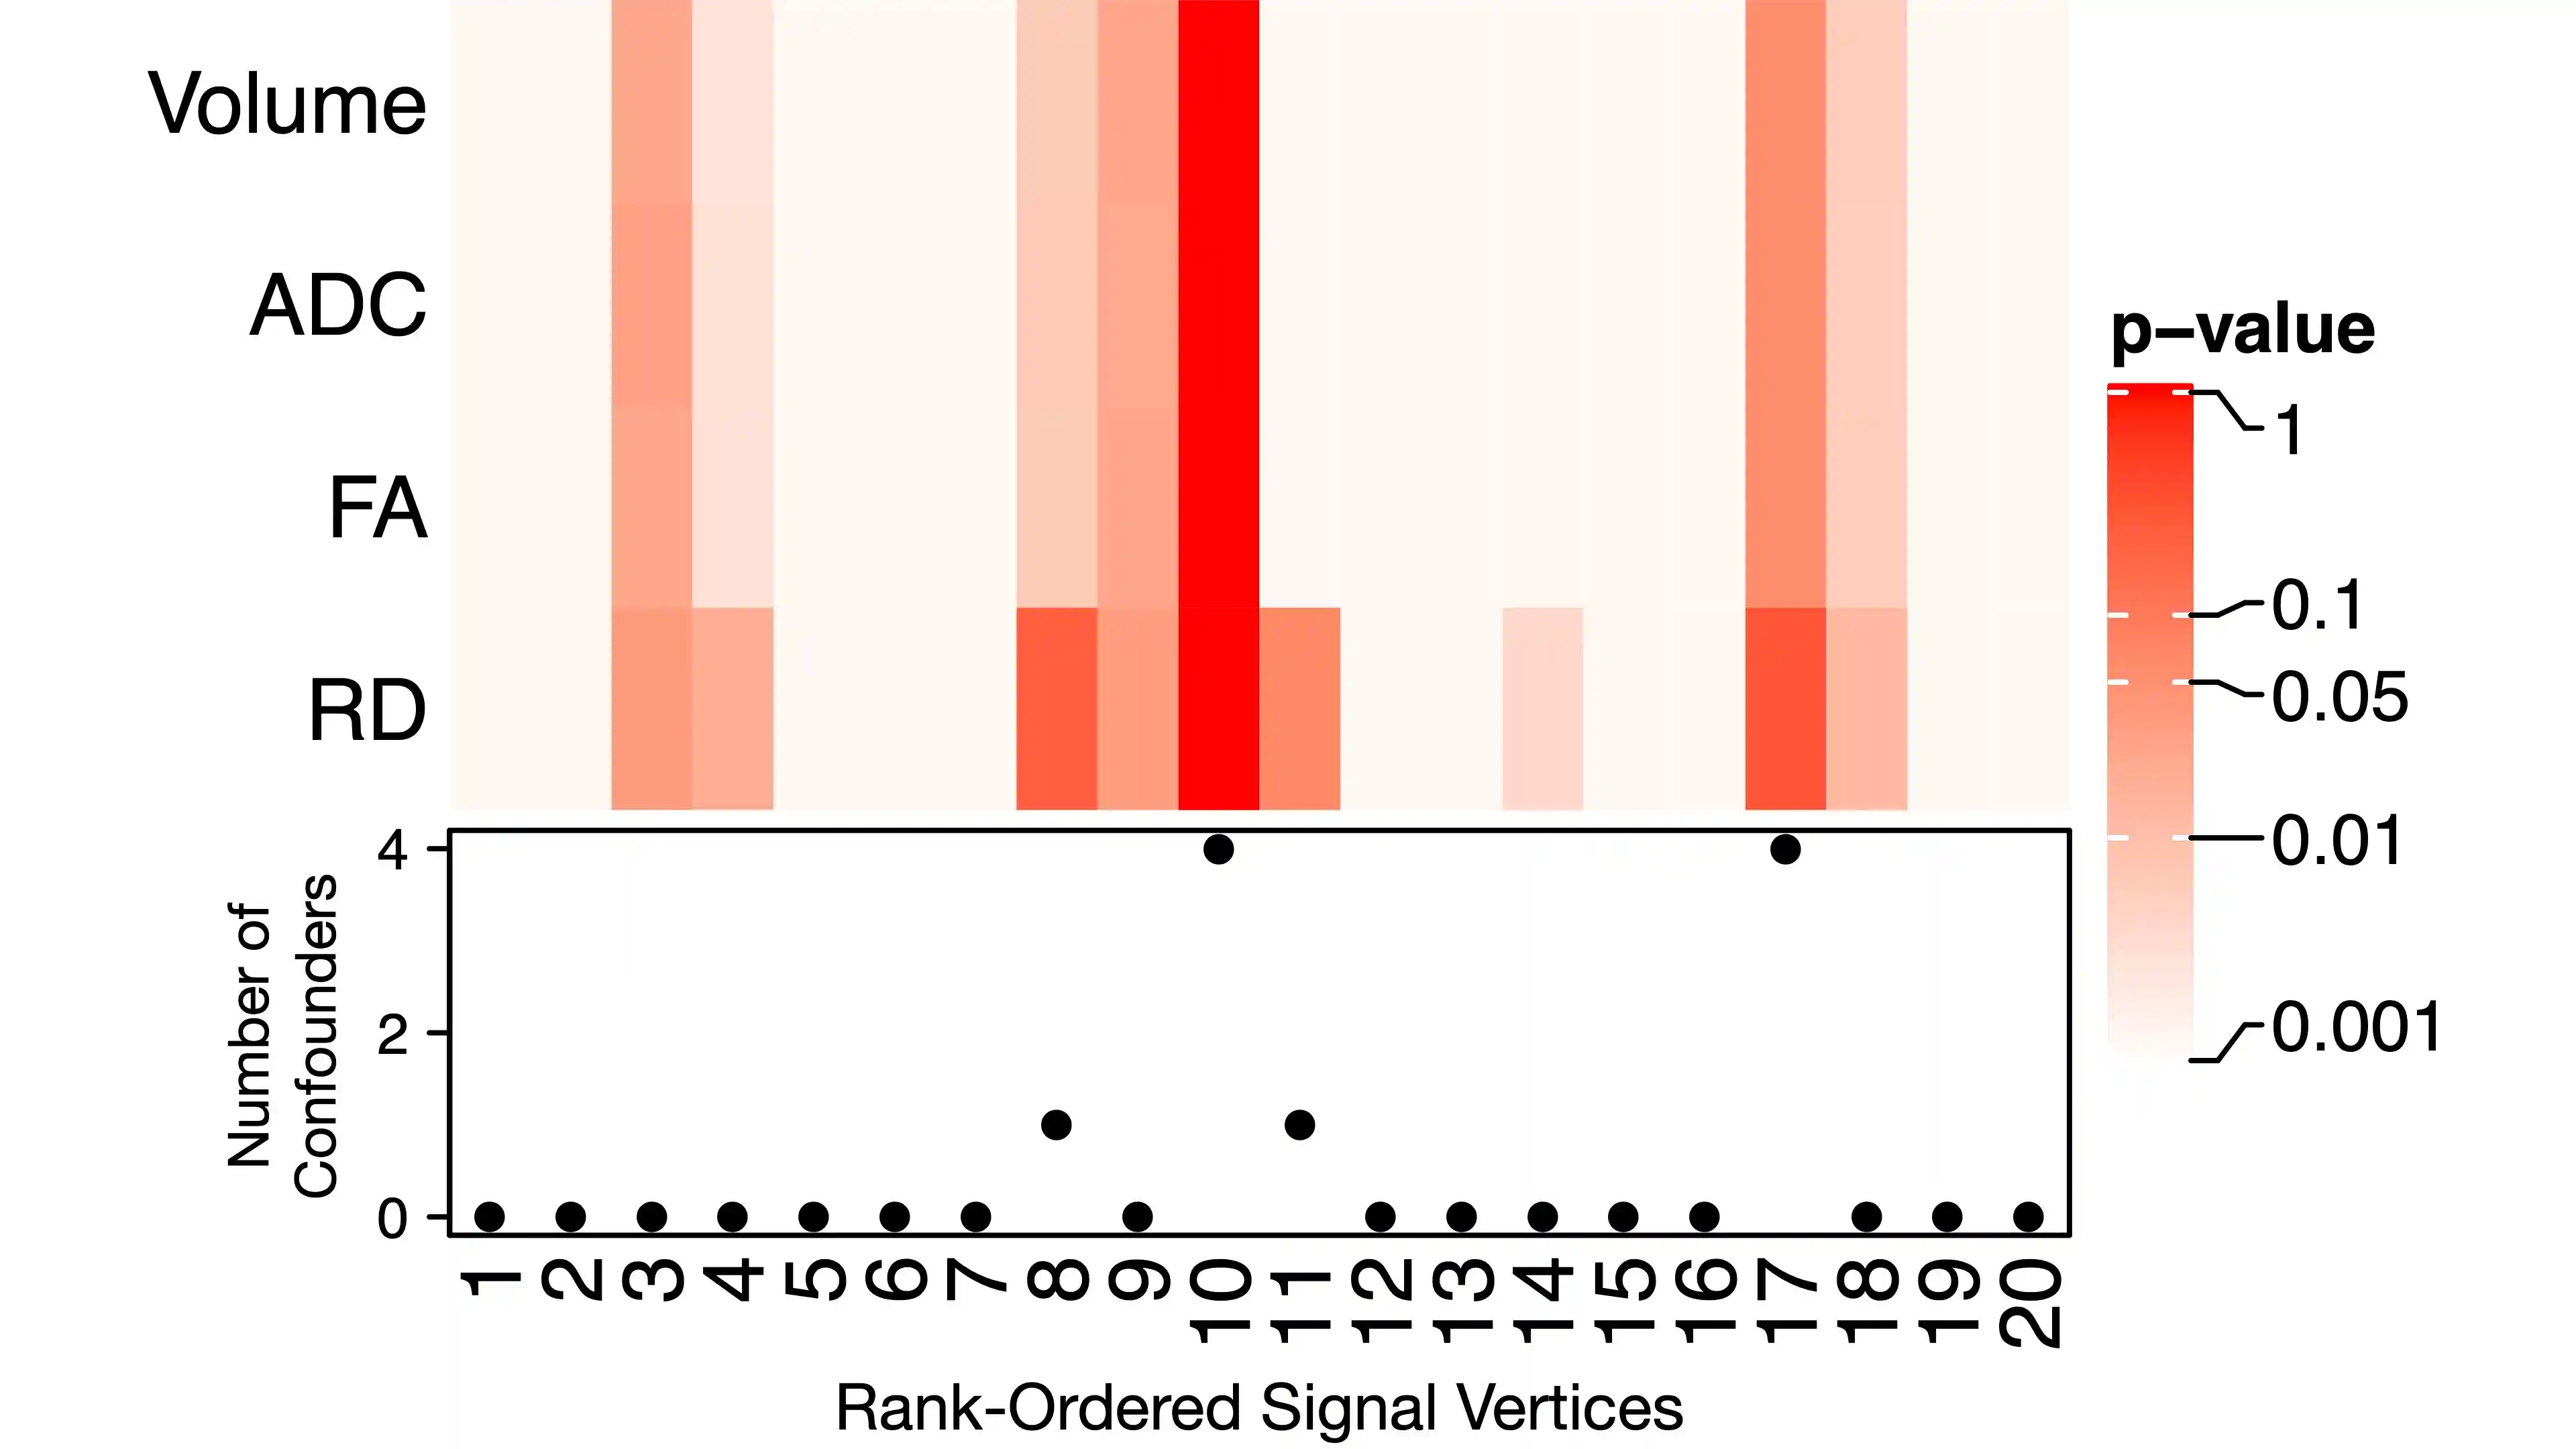
Figure 6: Our methods uncover more information about network topology than neuroanatomical metrics.
System Requirements
MCC uses both Python 3.8 and R 3.6.1.
The analyses above depend on the following packages:
# Conda Python packages
jupyter==1.0.0
rpy2==3.3.6
statsmodels==0.12.1

# Pip install the latest version of graspologic
graspologic @ git+git://github.com/microsoft/graspologic@dev

# Conda R packages
r-base==3.6.1
bioconductor-complexheatmap==2.2.0
r-cairo==1.5_10
r-circlize==0.4.12
r-data.table==1.12.2
r-essentials==3.6.0
r-future==1.21.0
r-future.apply==1.7.0
r-ggplot2==3.1.1
r-globaloptions==0.1.2
r-igraph==1.2.4.1
r-mltools==0.3.5
r-tidyverse==1.2.1

# CRAN R packages
cdcsis==2.0.3
These analyses have been tested on macOS x64 and Linux x64.
Installation Instructions
We created a computational environment with these packages using a dedicated Miniconda kernel (should take about 5 mins to setup):
conda env create --file environment.yml --name mcc
To get rpy2 running on an M1 Mac, it's currently necessary to install it in API mode: RPY2_CFFI_MODE=API pip install rpy2. Also, it might be easier to install the R packages directly through the scripting interface instead of through conda since many compatibility conflicts haven't been resolved for new arm64 versions.
Reproducing Figures
Scripts to reproduce the figures in MCC are organized below.
Figure 1
- Run
code/1_statistical_framework_graphs.ipynb(expected runtime: 5 seconds) - This script uses
igraphto generate the sample connectomes and graph models seen above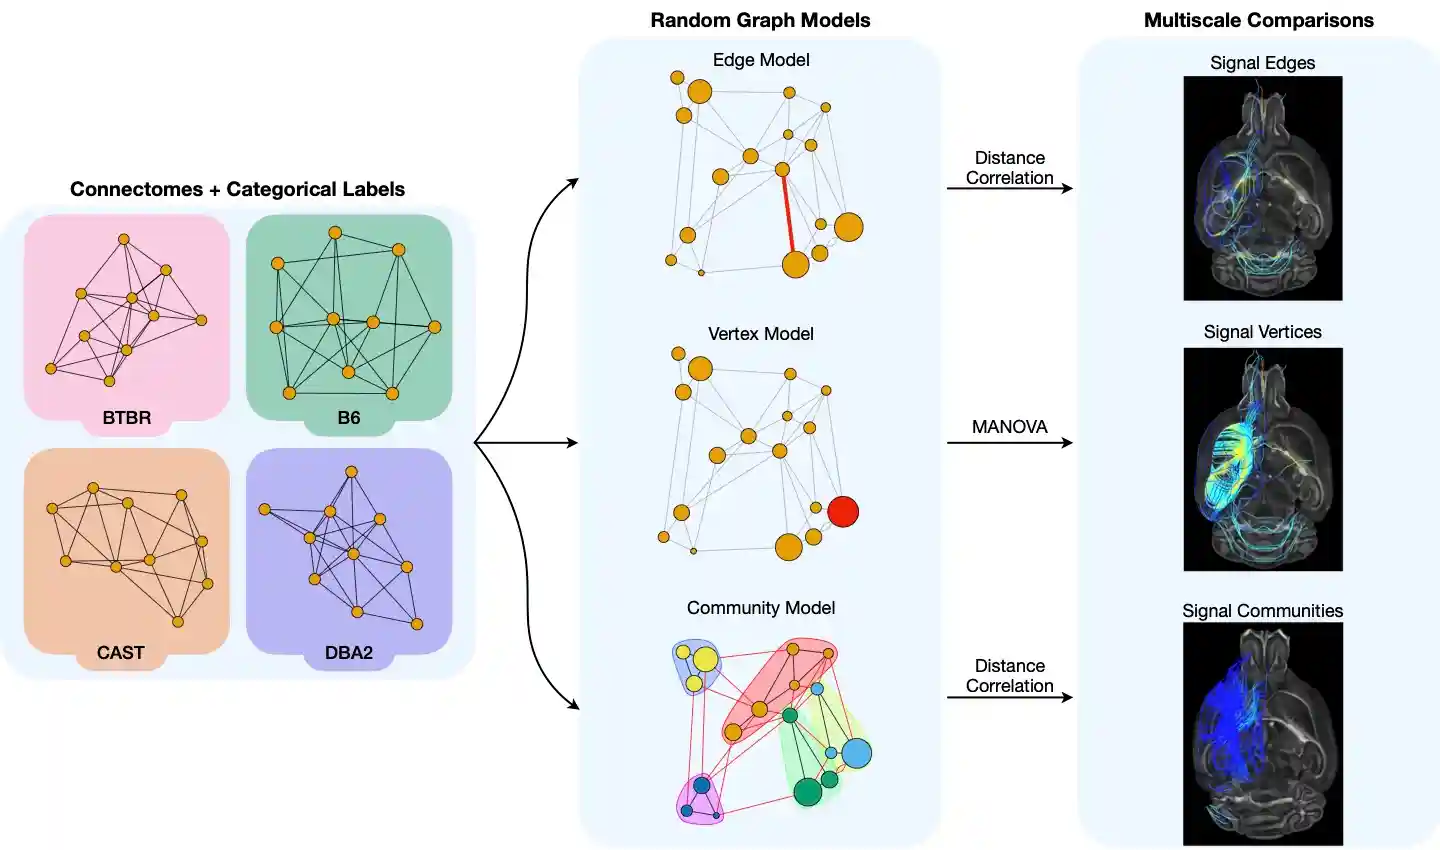

Figure 2
- Run
code/2_plot_adjacency_matrices.ipynb(expected runtime: 5 seconds) - This script uses
ComplexHeatmapto generate average connectomes for each mouse strain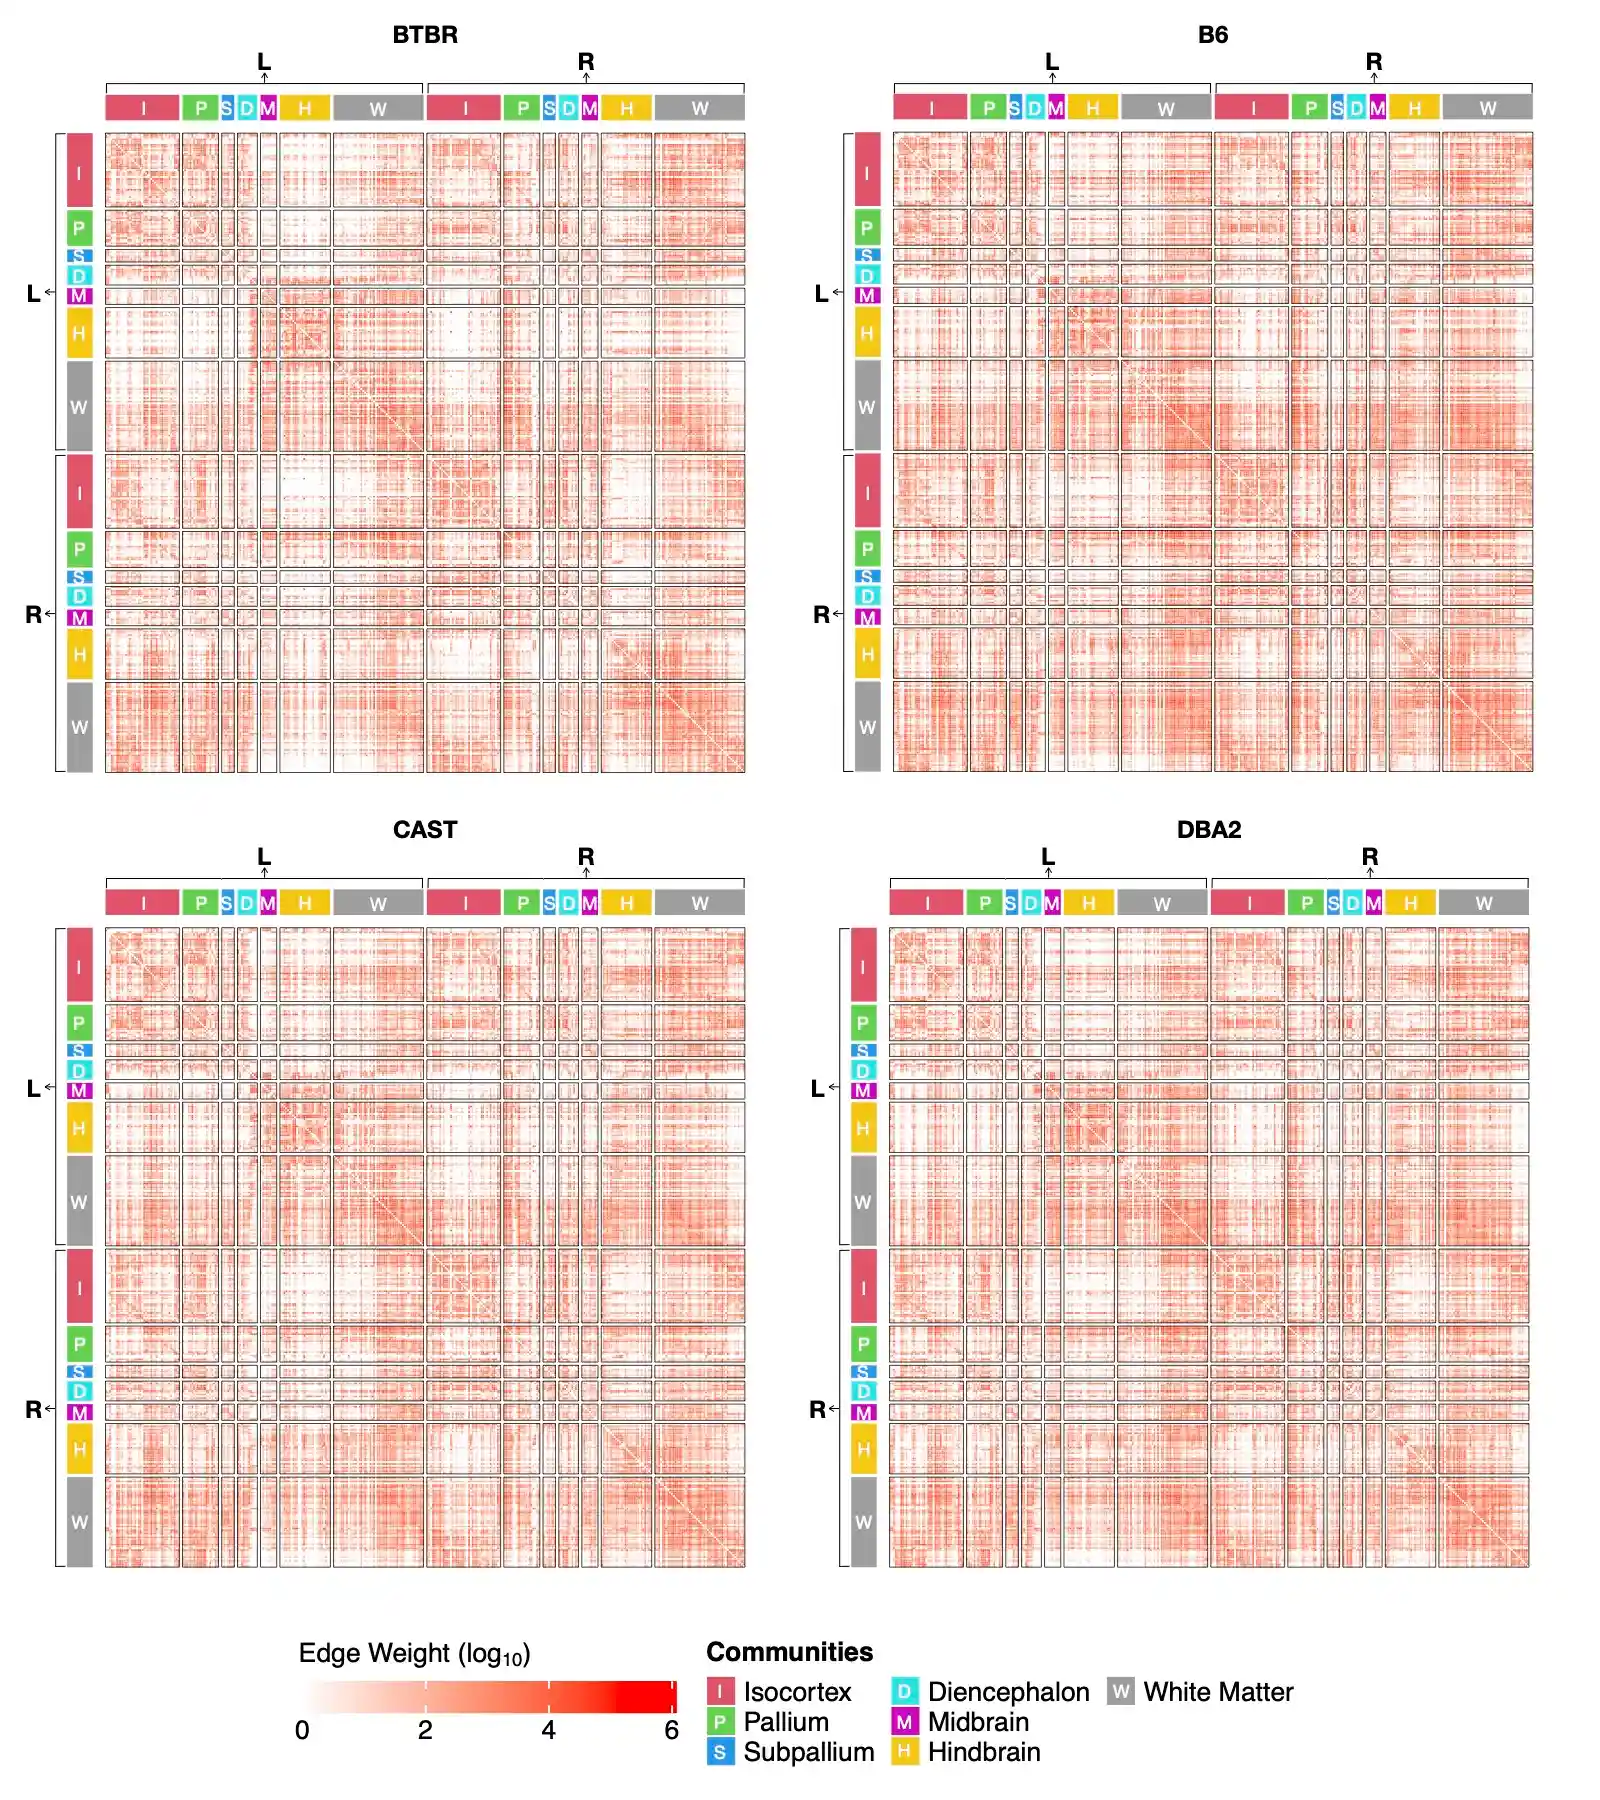

Figure 3
- Run
code/3_cc_emedding.ipynb(expected runtime: 5 seconds) - This script uses
graspologicto embed the corpus callosum brain region of every mouse in a low-dimensional space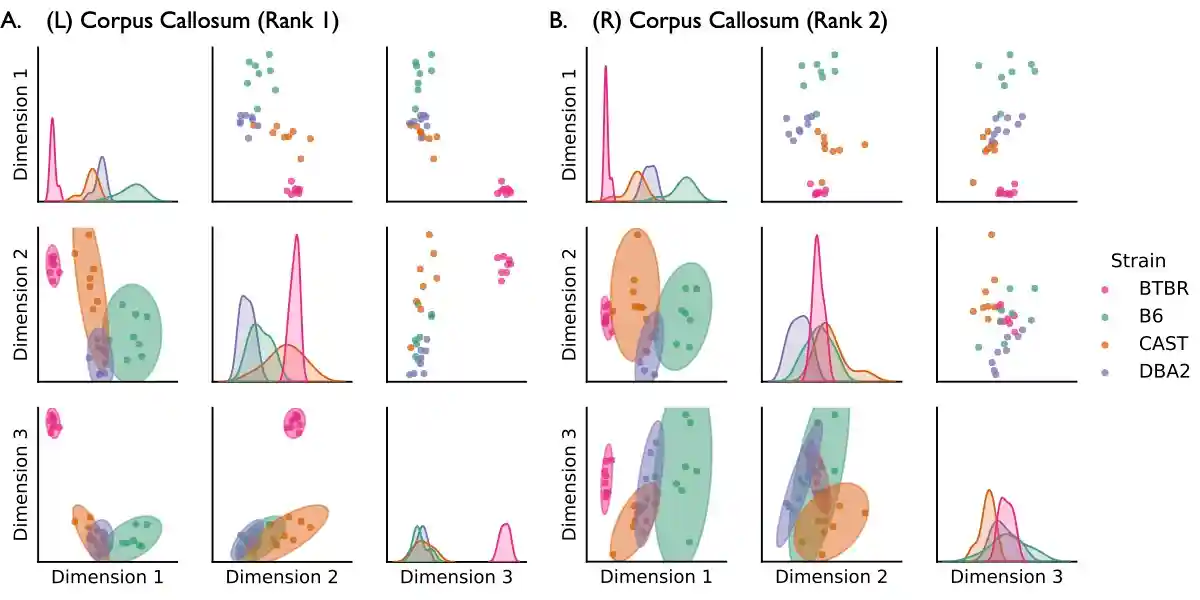

Figure 4
- Run
code/4a_identifying_signal_components.ipynb(expected runtime: 2 min) - This script uses
graspologicand various k-sample hypothesis testing packages to identify the strongest signal edges, vertices, and communities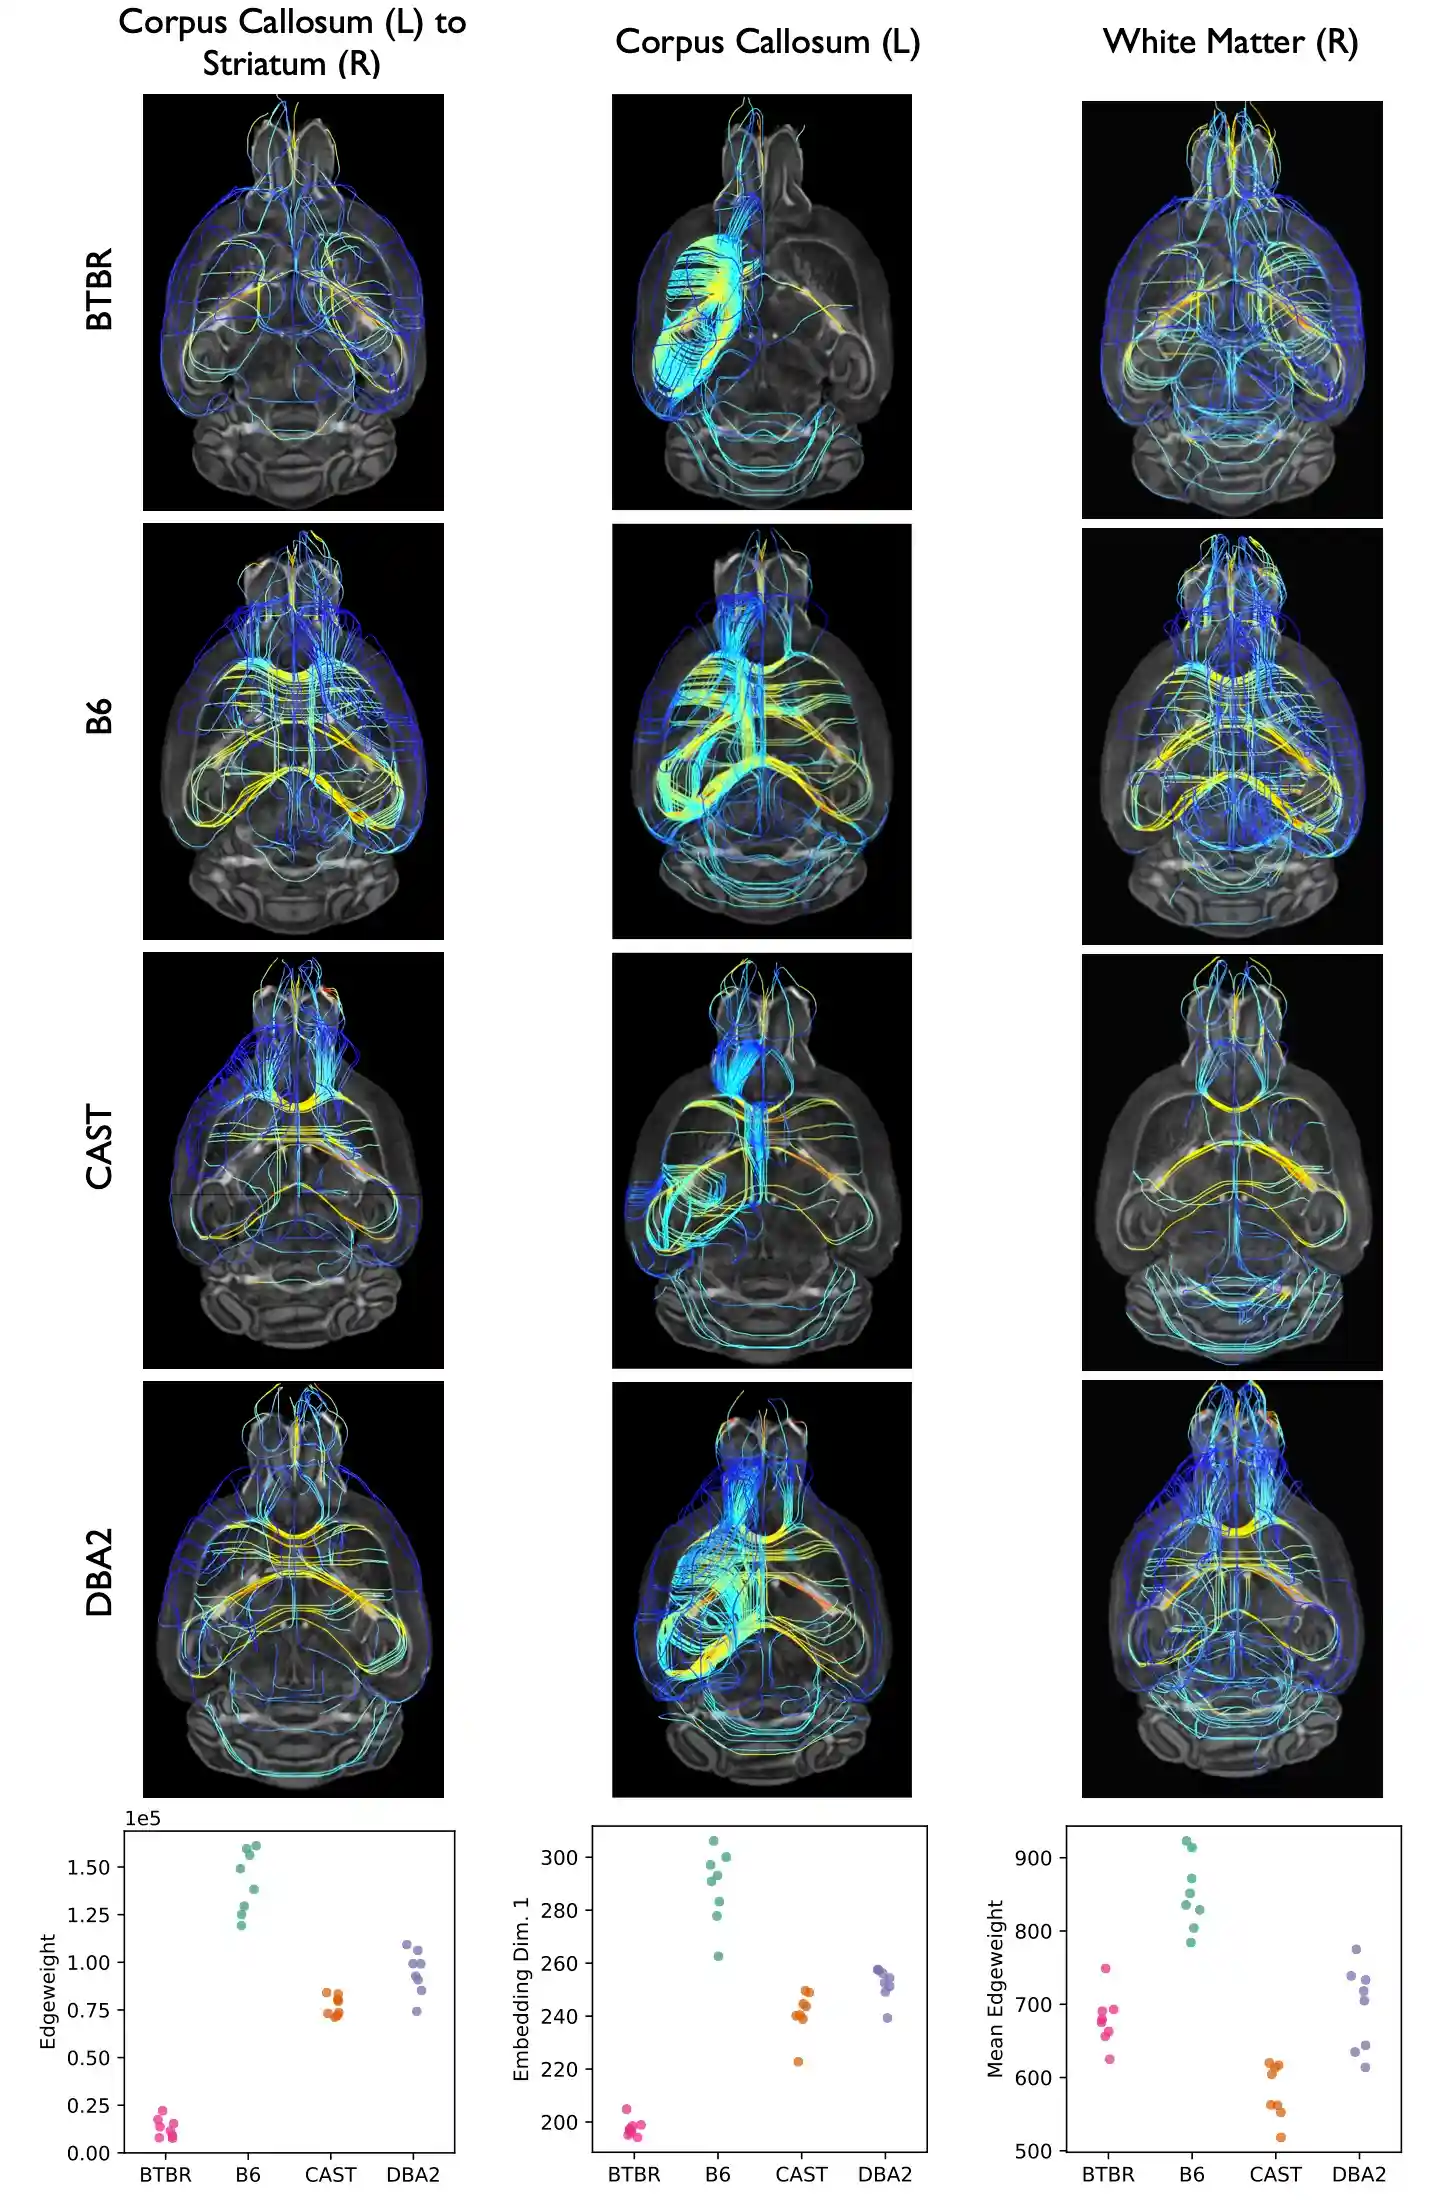

Tables 1-4
- Run
code/4b_format_signal_components_tables.ipynb(expected runtime: 30 seconds) - This script uses
pandasto nicely format the results generated for Figure 4 into publication-ready tables - Tables are found in the Supplement of the
MCCmanuscript
Figure 5
- Run
code/5_whole_brain_emedding.ipynb(expected runtime: 5 seconds) - This script uses classical multidimensional scaling (cMDS) to embed the results of the omnibus embedding in a low-dimensional space


Figure 6
- Run
code/6_conditional_independence_anatomy.ipynb(expected runtime: 5 hours on a 48 core machine, probably much longer on a normal laptop) - This script uses
cdcsisto compute a bunch of conditional independence tests - The purpose of this test is to determine if our methods recover information about network topology not encoded in neuroanatomy