Note
Go to the end to download the full example code.
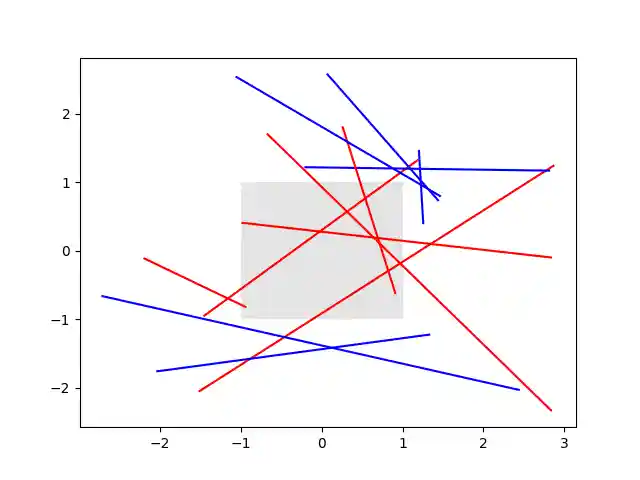
The lines intersecting the rectangle are colored in red, while the others
are left as blue lines. This example showcases the intersects_bbox function.
import matplotlib.pyplot as plt
import numpy as np

from matplotlib.path import Path
from matplotlib.transforms import Bbox

# Fixing random state for reproducibility
np.random.seed(19680801)


left, bottom, width, height = (-1, -1, 2, 2)
rect = plt.Rectangle((left, bottom), width, height,
                     facecolor="black", alpha=0.1)

fig, ax = plt.subplots()
ax.add_patch(rect)

bbox = Bbox.from_bounds(left, bottom, width, height)

for i in range(12):
    vertices = (np.random.random((2, 2)) - 0.5) * 6.0
    path = Path(vertices)
    if path.intersects_bbox(bbox):
        color = 'r'
    else:
        color = 'b'
    ax.plot(vertices[:, 0], vertices[:, 1], color=color)

plt.show()