plotnine 0.15.3
theme(
    complete=False,
    axis_title_x=None,
    axis_title_y=None,
    axis_title=None,
    legend_title=None,
    legend_text_legend=None,
    legend_text_colorbar=None,
    legend_text=None,
    plot_title=None,
    plot_subtitle=None,
    plot_caption=None,
    plot_tag=None,
    plot_title_position=None,
    plot_caption_position=None,
    plot_tag_location=None,
    plot_tag_position=None,
    strip_text_x=None,
    strip_text_y=None,
    strip_text=None,
    title=None,
    axis_text_x=None,
    axis_text_y=None,
    axis_text=None,
    text=None,
    axis_line_x=None,
    axis_line_y=None,
    axis_line=None,
    axis_ticks_minor_x=None,
    axis_ticks_minor_y=None,
    axis_ticks_major_x=None,
    axis_ticks_major_y=None,
    axis_ticks_major=None,
    axis_ticks_minor=None,
    axis_ticks_x=None,
    axis_ticks_y=None,
    axis_ticks=None,
    legend_ticks=None,
    panel_grid_major_x=None,
    panel_grid_major_y=None,
    panel_grid_minor_x=None,
    panel_grid_minor_y=None,
    panel_grid_major=None,
    panel_grid_minor=None,
    panel_grid=None,
    line=None,
    legend_key=None,
    legend_frame=None,
    legend_background=None,
    legend_box_background=None,
    panel_background=None,
    panel_border=None,
    plot_background=None,
    strip_background_x=None,
    strip_background_y=None,
    strip_background=None,
    rect=None,
    axis_ticks_length_major_x=None,
    axis_ticks_length_major_y=None,
    axis_ticks_length_major=None,
    axis_ticks_length_minor_x=None,
    axis_ticks_length_minor_y=None,
    axis_ticks_length_minor=None,
    axis_ticks_length=None,
    panel_spacing_x=None,
    panel_spacing_y=None,
    panel_spacing=None,
    plot_margin_left=None,
    plot_margin_right=None,
    plot_margin_top=None,
    plot_margin_bottom=None,
    plot_margin=None,
    panel_ontop=None,
    aspect_ratio=None,
    dpi=None,
    figure_size=None,
    legend_box=None,
    legend_box_margin=None,
    legend_box_just=None,
    legend_justification_right=None,
    legend_justification_left=None,
    legend_justification_top=None,
    legend_justification_bottom=None,
    legend_justification_inside=None,
    legend_justification=None,
    legend_direction=None,
    legend_key_width=None,
    legend_key_height=None,
    legend_key_size=None,
    legend_ticks_length=None,
    legend_margin=None,
    legend_box_spacing=None,
    legend_spacing=None,
    legend_position_inside=None,
    legend_position=None,
    legend_title_position=None,
    legend_text_position=None,
    legend_key_spacing_x=None,
    legend_key_spacing_y=None,
    legend_key_spacing=None,
    strip_align_x=None,
    strip_align_y=None,
    strip_align=None,
    svg_usefonts=None,
    **kwargs
)
Base class for themes
In general, only complete themes should subclass this class.
Parameters
complete : bool = False-
Themes that are complete will override any existing themes. themes that are not complete (ie. partial) will add to or override specific elements of the current theme. e.g:
theme_gray() + theme_xkcd()will be completely determined by
theme_xkcd, but:theme_gray() + theme(axis_text_x=element_text(angle=45))will only modify the x-axis text.
kwargs-
kwargs are
themeables. The themeables are elements that are subclasses ofthemeable. Many themeables are defined using theme elements i.eelement_lineelement_rectelement_text
These simply bind together all the aspects of a themeable that can be themed. See
themeable.
Notes
When subclassing, make sure to call theme.__init__. After which you can customise self._rcParams within the __init__ method of the new theme. The rcParams should not be modified after that.
Examples
from plotnine import (
    ggplot,
    aes,
    geom_point,
    facet_grid,
    labs,
    guide_legend,
    guides,
    theme,
    element_text,
    element_line,
    element_rect,
    theme_set,
    theme_void,
)
from plotnine.data import mtcars

# We use theme_void as the base theme so that the modifications
# we make in the code are transparent in the output
theme_set(theme_void())| name | mpg | cyl | disp | hp | drat | wt | qsec | vs | am | gear | carb | |
|---|---|---|---|---|---|---|---|---|---|---|---|---|
| 0 | Mazda RX4 | 21.0 | 6 | 160.0 | 110 | 3.90 | 2.620 | 16.46 | 0 | 1 | 4 | 4 |
| 1 | Mazda RX4 Wag | 21.0 | 6 | 160.0 | 110 | 3.90 | 2.875 | 17.02 | 0 | 1 | 4 | 4 |
| 2 | Datsun 710 | 22.8 | 4 | 108.0 | 93 | 3.85 | 2.320 | 18.61 | 1 | 1 | 4 | 1 |
| 3 | Hornet 4 Drive | 21.4 | 6 | 258.0 | 110 | 3.08 | 3.215 | 19.44 | 1 | 0 | 3 | 1 |
| 4 | Hornet Sportabout | 18.7 | 8 | 360.0 | 175 | 3.15 | 3.440 | 17.02 | 0 | 0 | 3 | 2 |
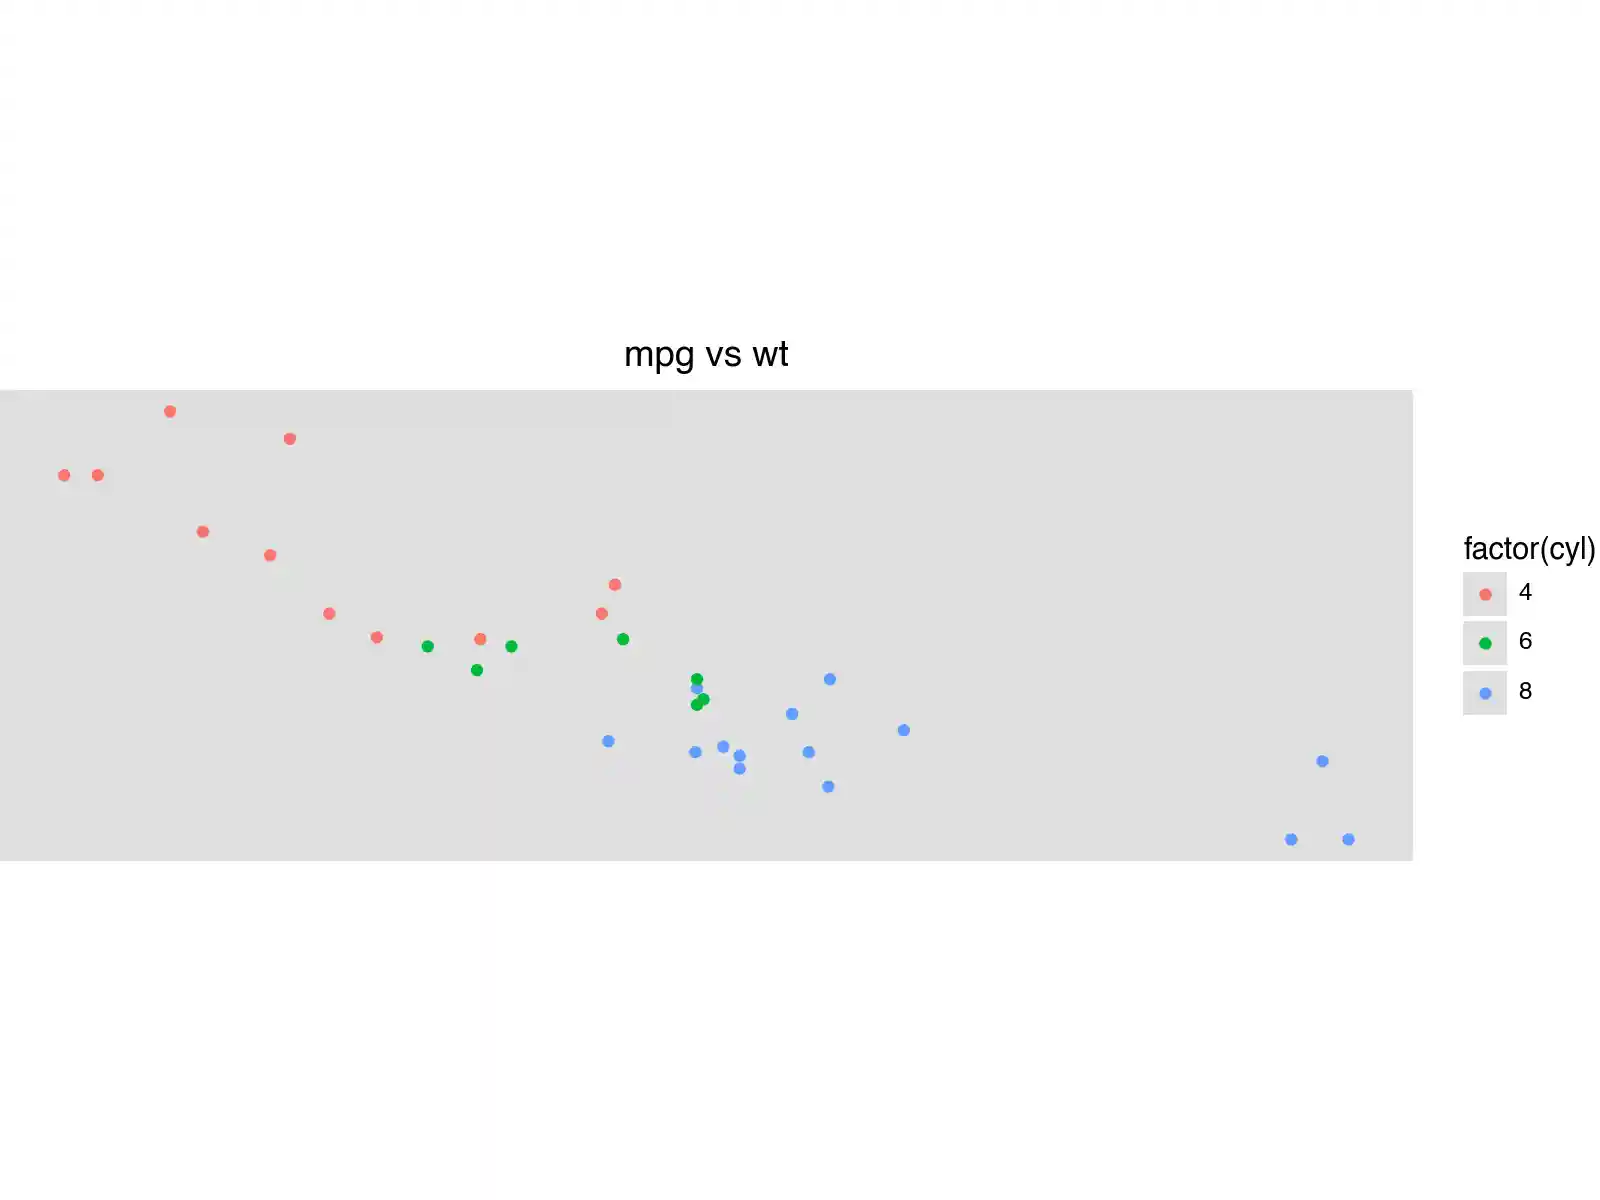
The base plots we will use for the demonstation and some colors.
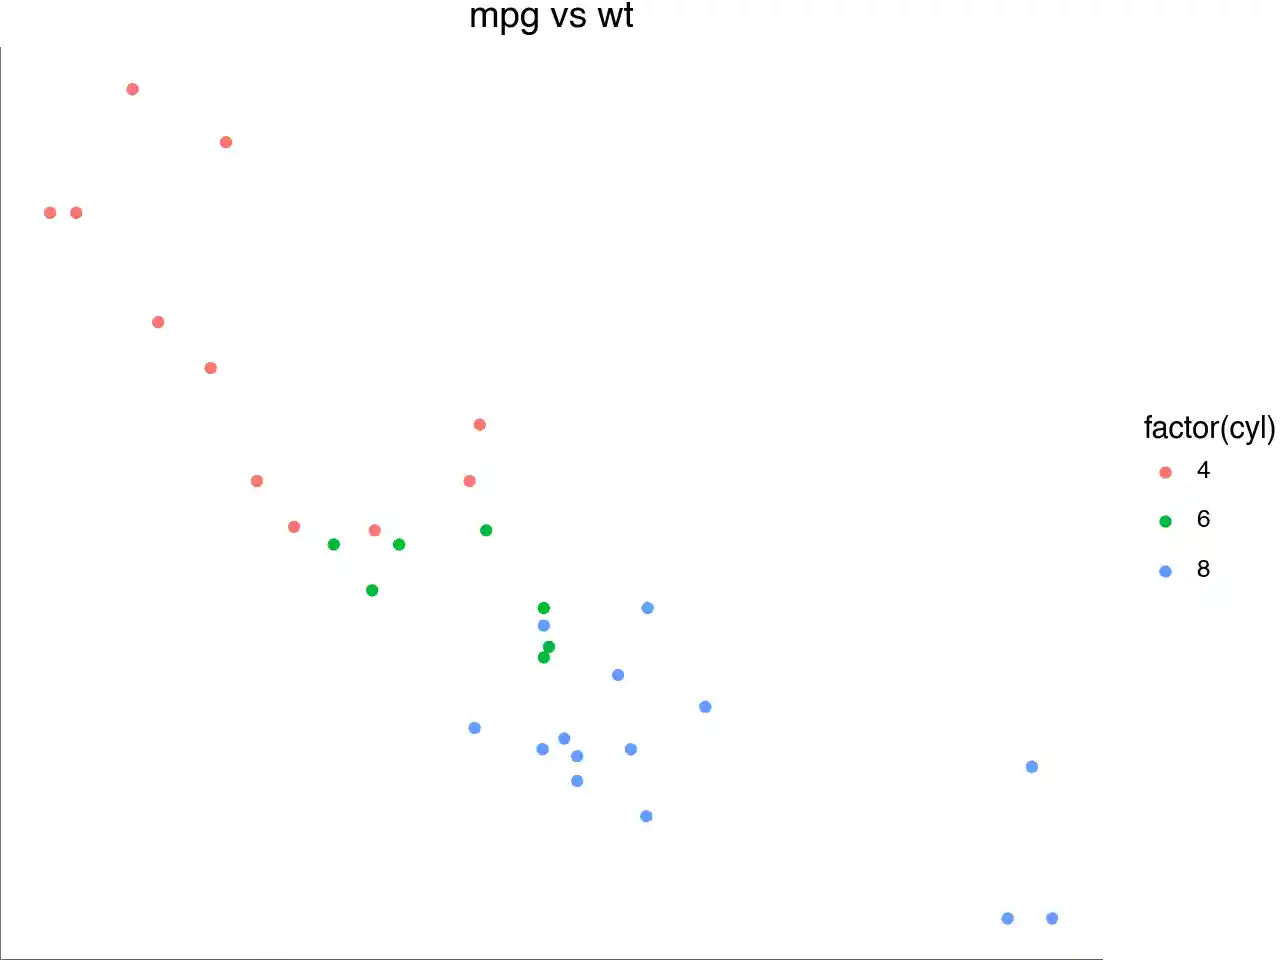
p1 = (
ggplot(mtcars, aes("wt", "mpg", color="factor(cyl)"))
+ geom_point()
+ labs(title="mpg vs wt")
)
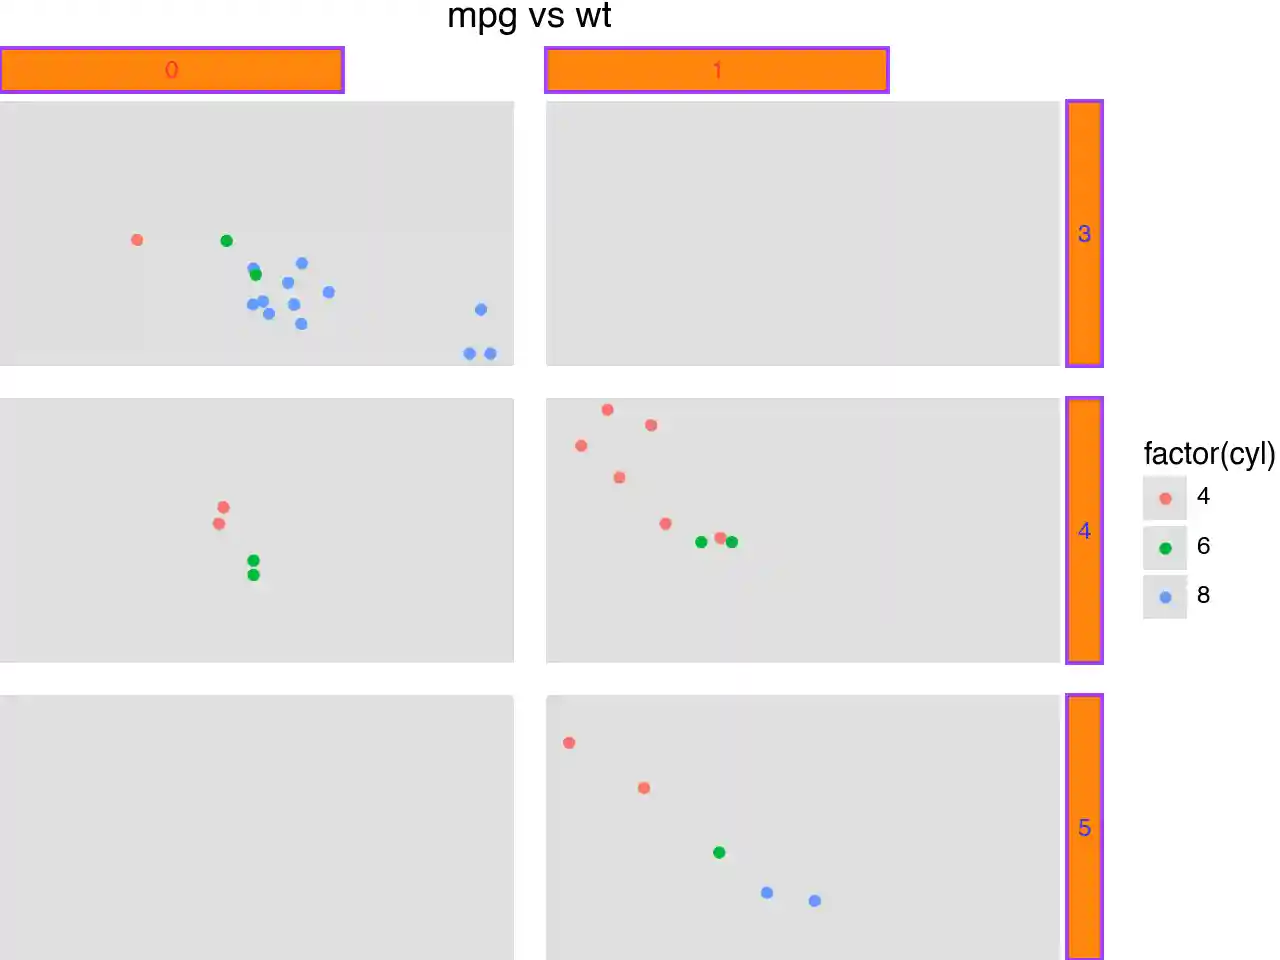
p2 = p1 + facet_grid("gear", "am")
black = "#222222"
gray = "#666666"
red = "#FF3333"
green = "#66CC00"
blue = "#3333FF"
purple = "#9933FF"
orange = "#FF8000"
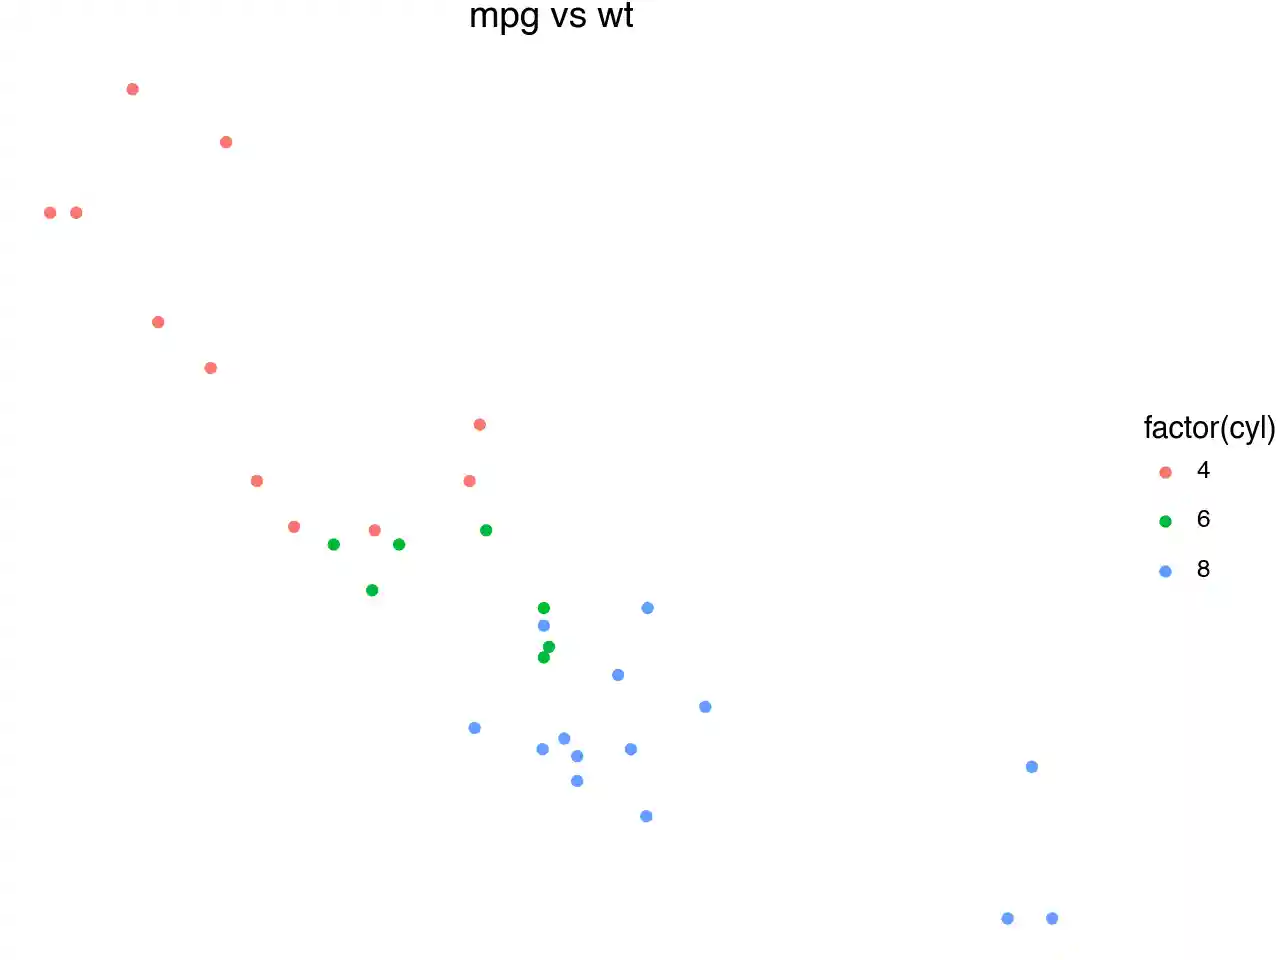
yellow = "#FFFF33"What the plots look like unmodified (unthemed).
There are 3 main top level theming elements:
text- controls all the text elements in the figure.rect- controls all the rectangles in the figure.line- controls all the lines in the figure.
Note that none of the themeables control/modify the plotted data. e.g You cannot use text to change the appearance of objects plotted with geom_text.
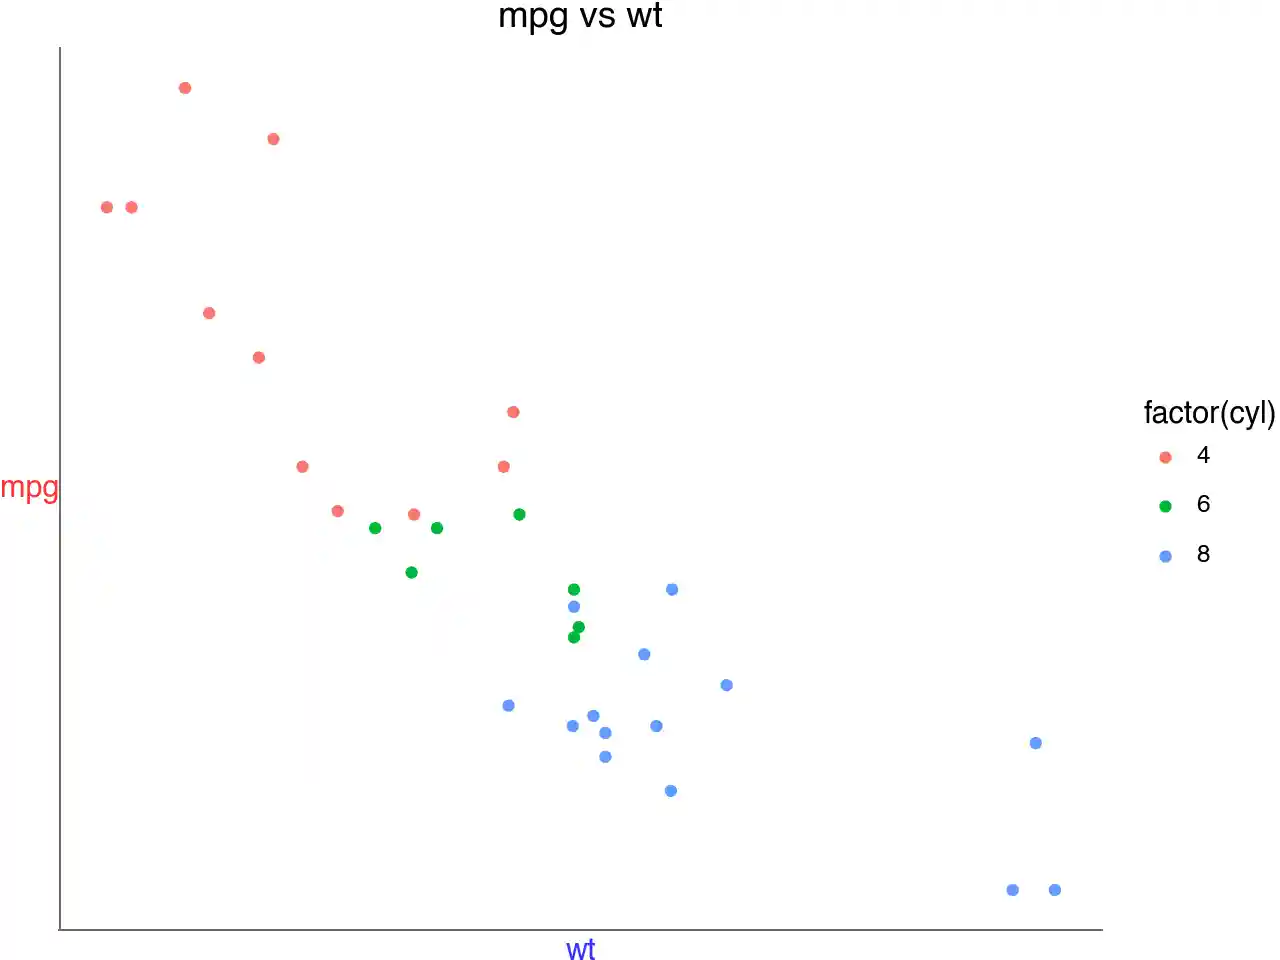
text
p1 + theme(text=element_text(color=purple))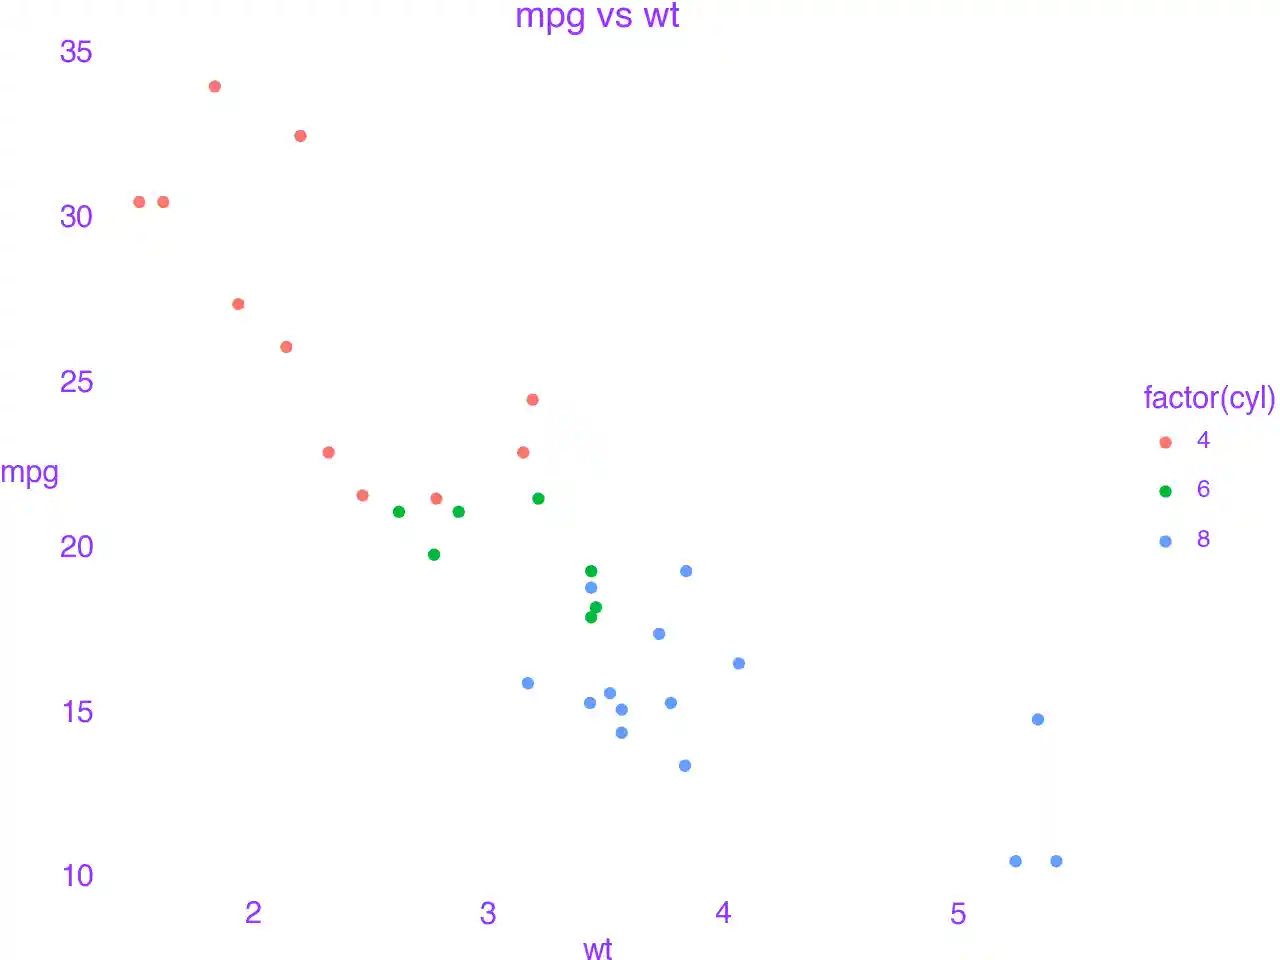
rect
p1 + theme(rect=element_rect(color=black, size=3, fill="#EEBB0050"))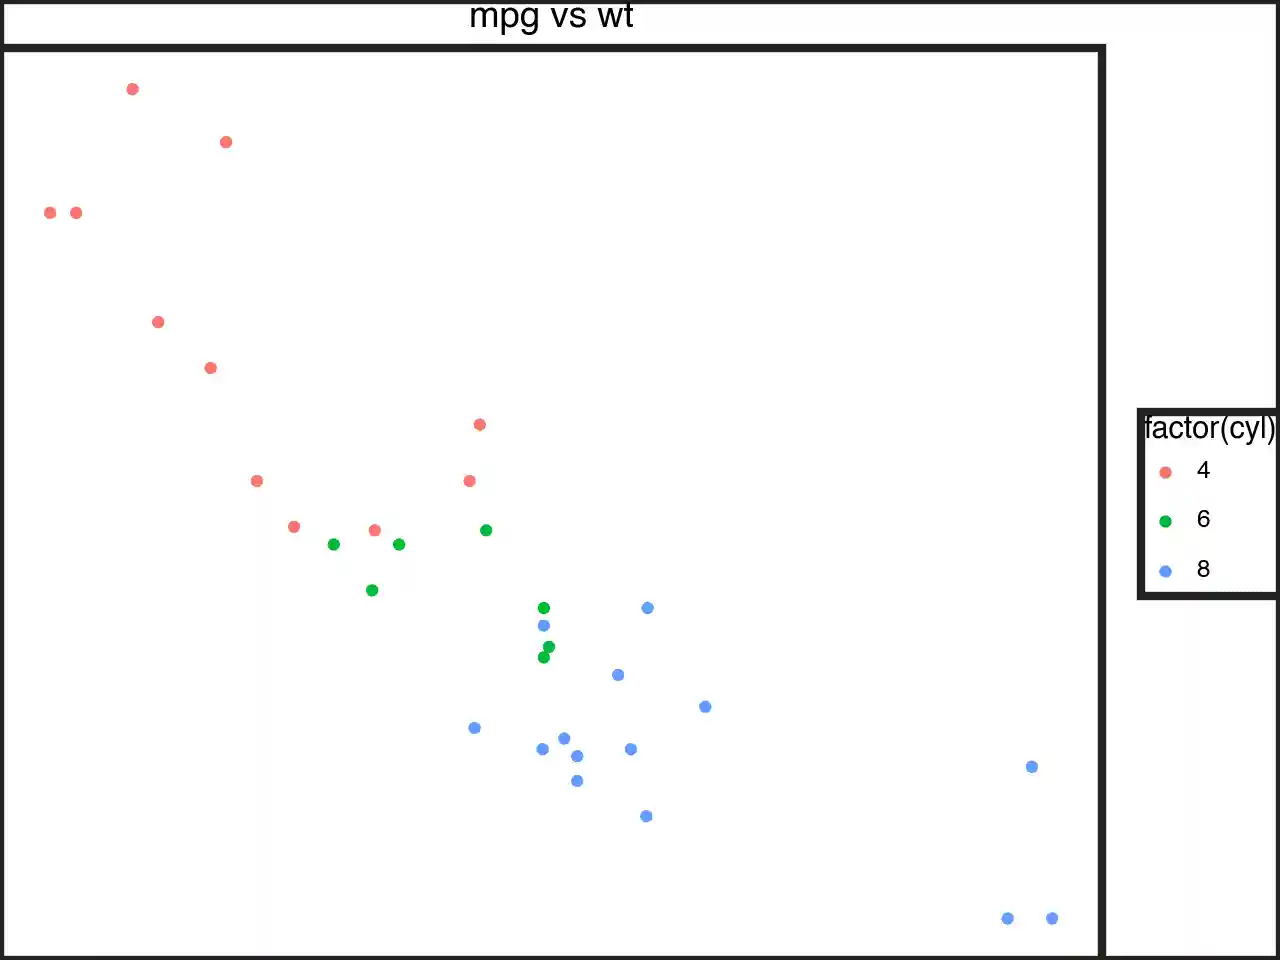
line
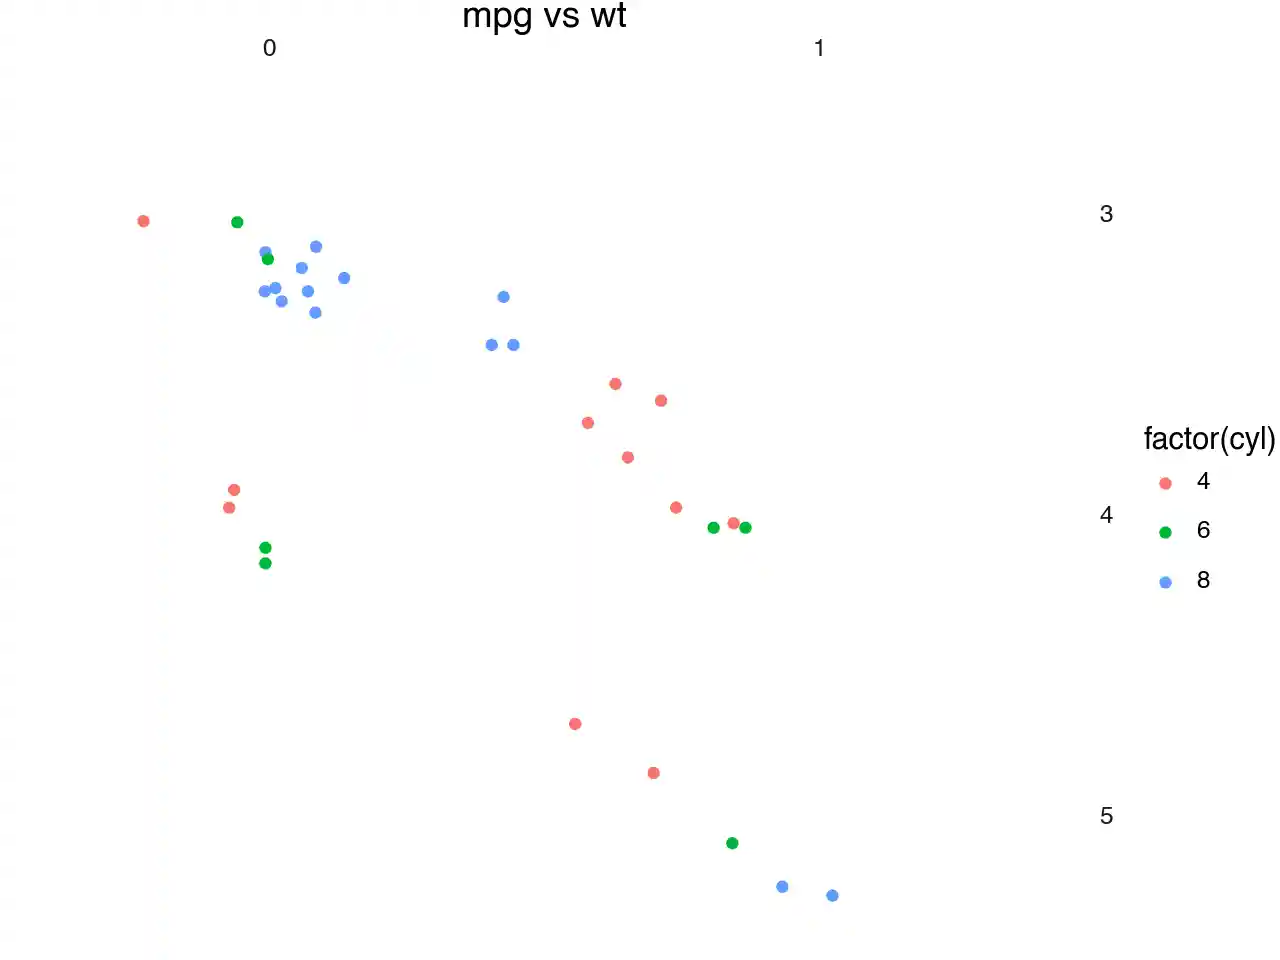
p1 + theme(line=element_line(color=black))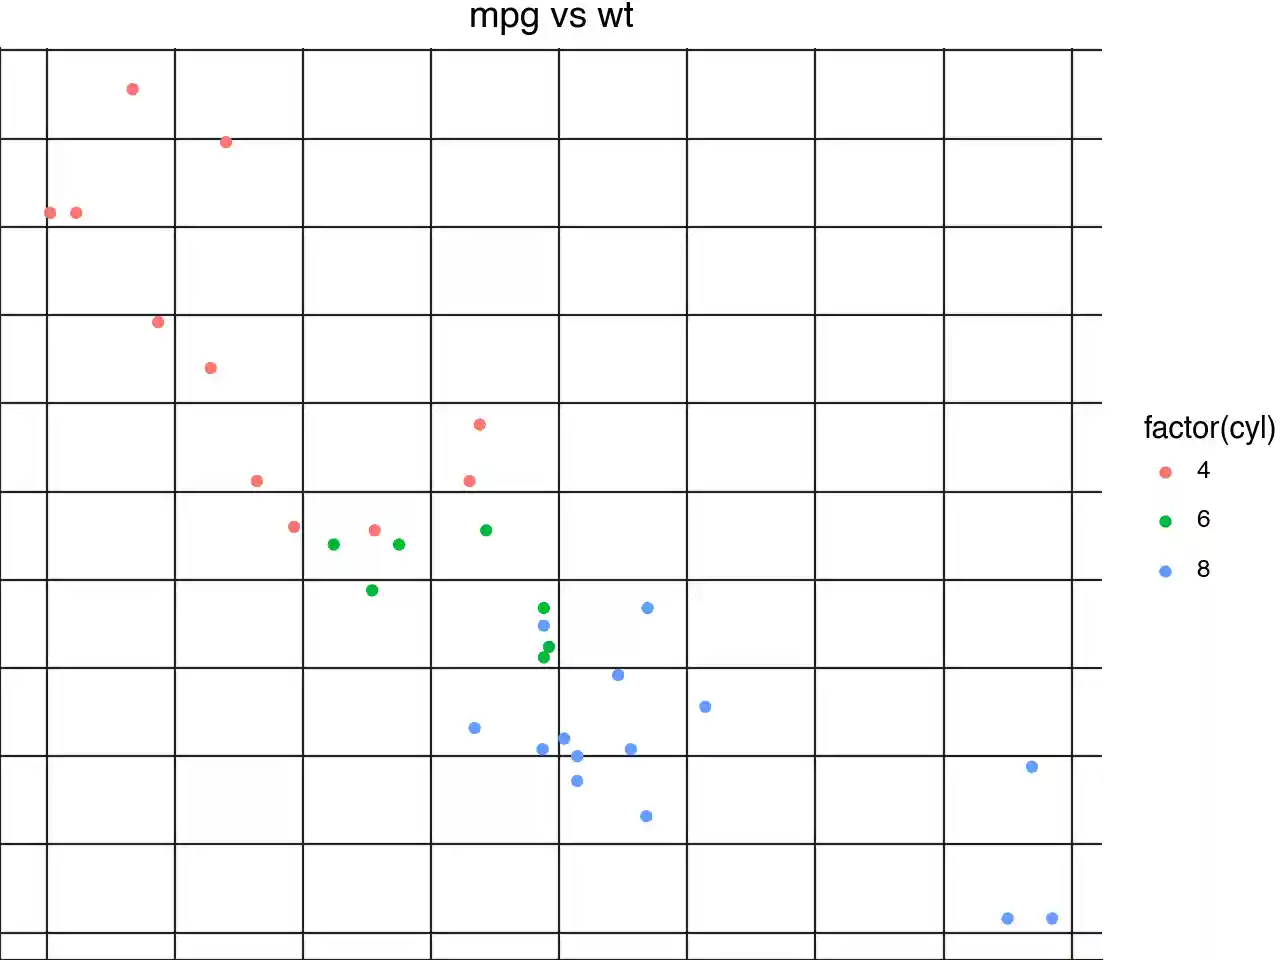
Theming specific items
axis_line and axis_text
p1 + theme(
    axis_line=element_line(size=2),
    axis_line_x=element_line(color=red),
    axis_line_y=element_line(color=blue),
    axis_text=element_text(margin={"t": 5, "r": 5}),
    axis_text_x=element_text(color=black),
    axis_text_y=element_text(color=purple),
)
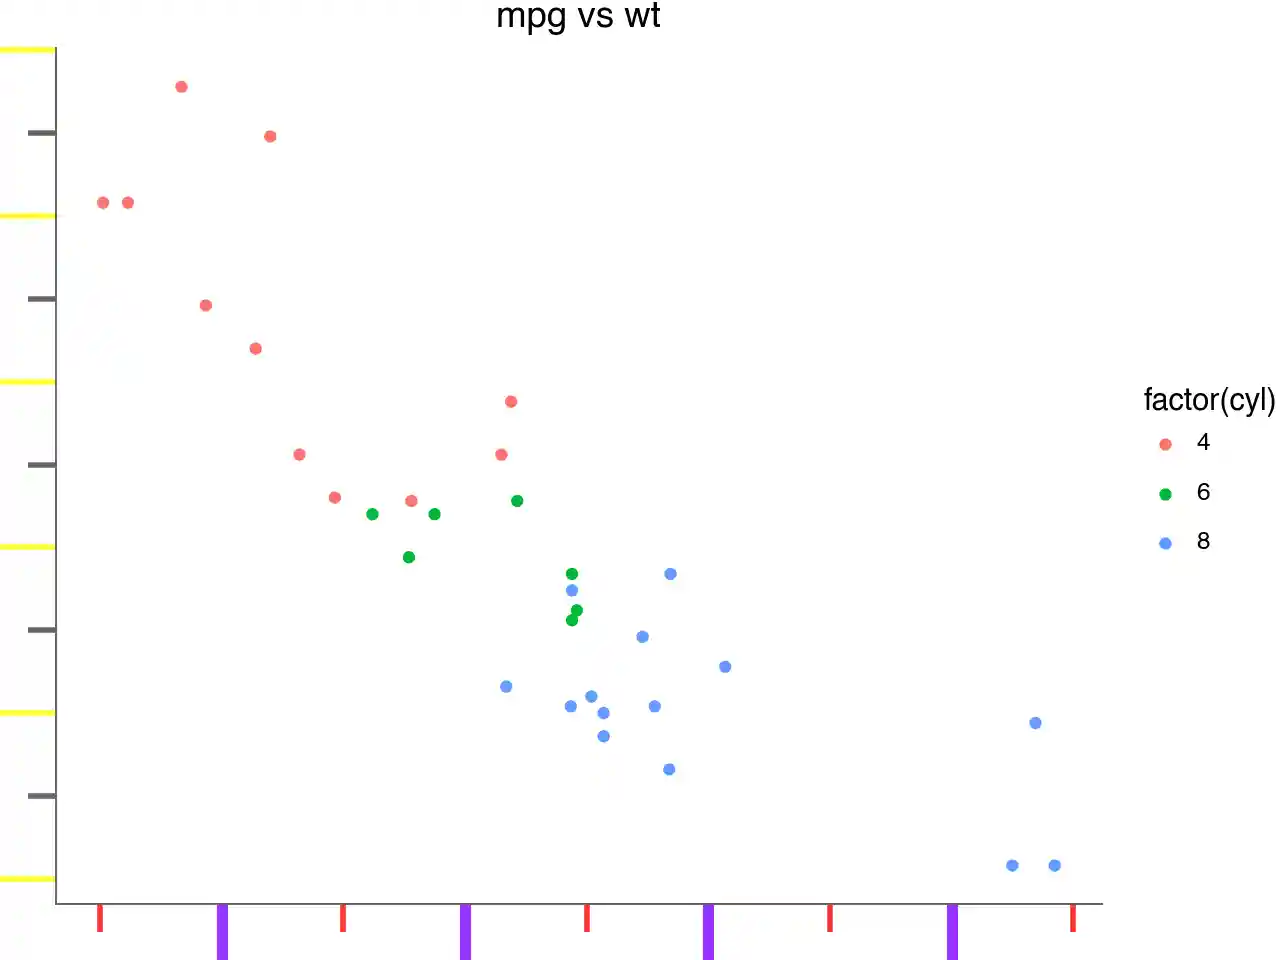
p1 + theme(
    axis_line=element_line(size=0.7, color=gray),
    # We are focusing on the ticks, make them long
    axis_ticks_length=20,
    axis_ticks_length_minor=10,
    axis_ticks_length_major=20,
    axis_ticks=element_line(size=2),
    axis_ticks_major=element_line(color=purple),
    axis_ticks_major_x=element_line(size=4),  # override size=2
    axis_ticks_major_y=element_line(color=yellow),  # override color=purple
    axis_ticks_minor=element_line(color=red),
    axis_ticks_minor_x=element_line(),  # do not override anything
    axis_ticks_minor_y=element_line(color=gray),  # override color=red
)
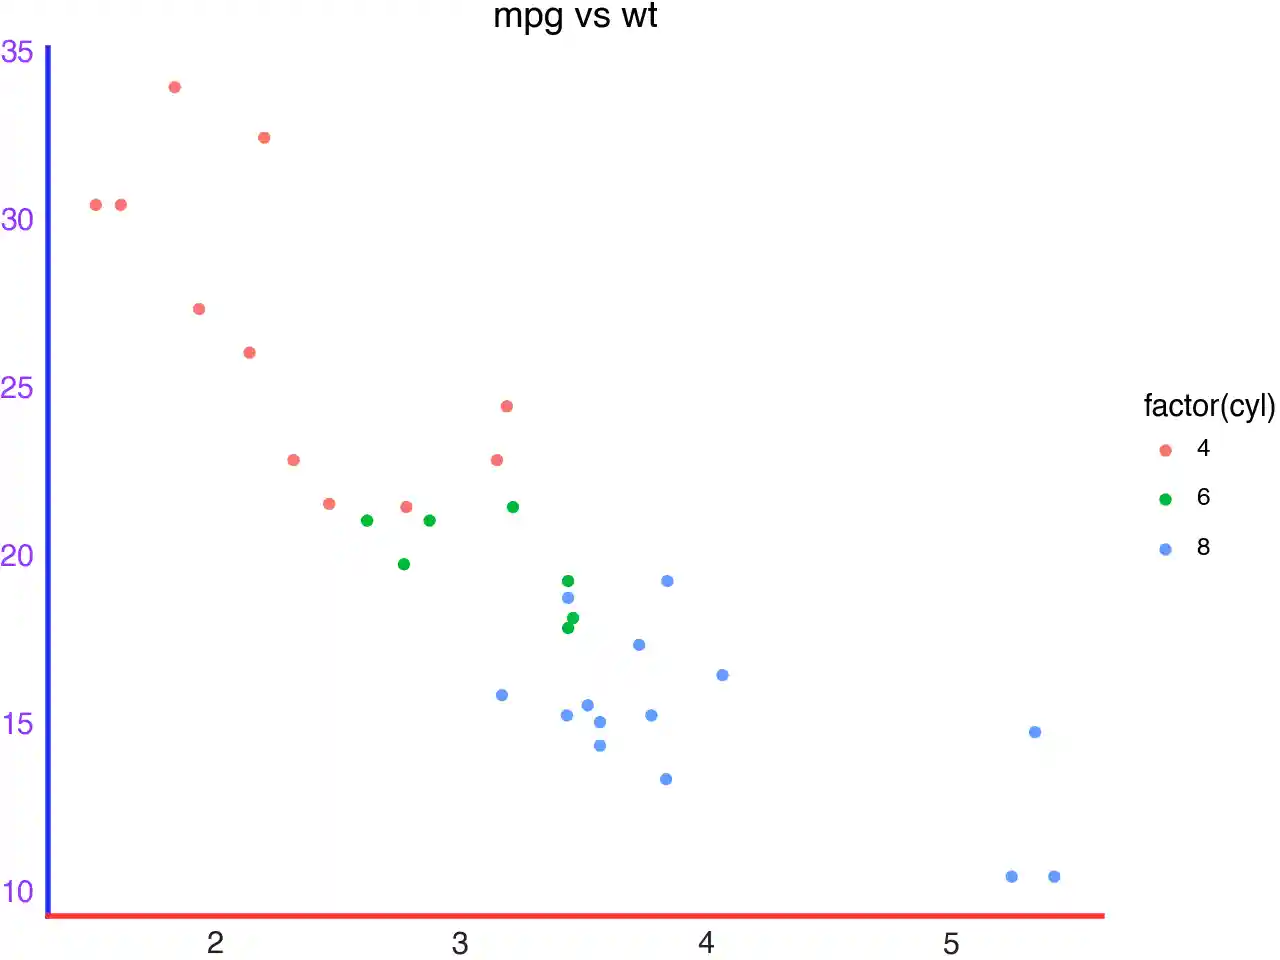
axis_title and axis_ticks_pad
p1 + theme(
    axis_line=element_line(size=0.7, color=gray),
    axis_ticks=element_line(),
    axis_title=element_text(),
    axis_title_x=element_text(color=blue),
    axis_title_y=element_text(color=red),
    # The gap between the title and the ticks
    axis_ticks_pad=20,
    axis_ticks_pad_major=20,
    axis_ticks_pad_minor=20,
)
axis_ticks_direction
p1 + theme(
    axis_line=element_line(size=0.7, color=gray),
    axis_ticks=element_line(),
    axis_ticks_direction="in",
    axis_ticks_direction_x="in",
    axis_ticks_direction_y="out",
)
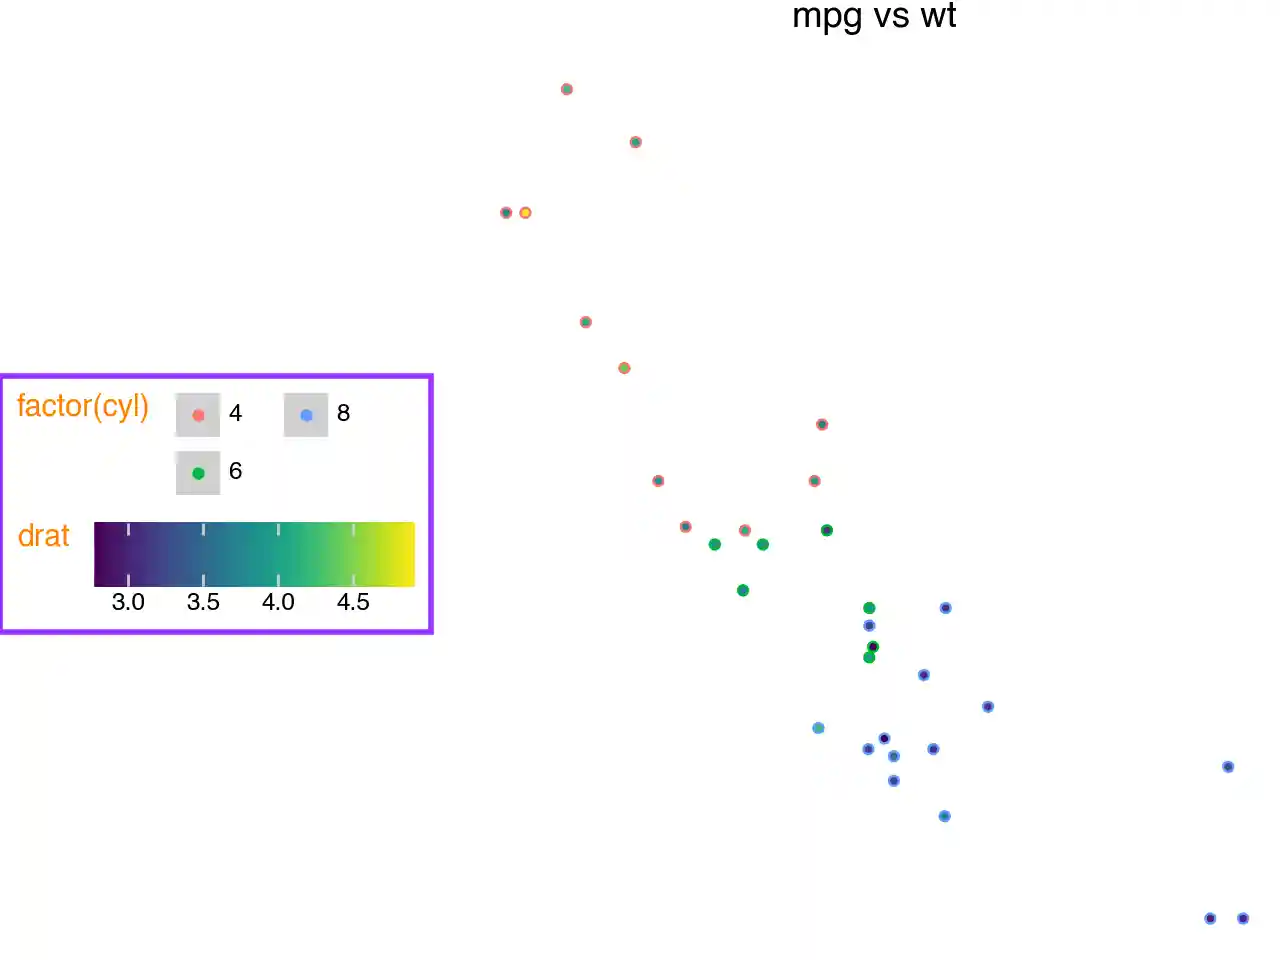
Legend_box
Not all themeables that affect the legend box are demonstrated
(
    p1
    + aes(fill="drat")
    + theme(
        legend_position="left",
        legend_direction="horizontal",  # affected by the ncol=2
        legend_box_margin=5,
        legend_background=element_rect(color=purple, size=2, fill="white"),
        legend_box="vertical",
        legend_key=element_rect(fill=gray, alpha=0.3),
        legend_title=element_text(color=orange, va="top"),
        legend_text=element_text(weight="bold"),
        legend_key_spacing=10,  # overridden
        legend_key_spacing_x=15,
        legend_key_spacing_y=5,
    )
    # so we can see legend_entry_spacing in action
    + guides(color=guide_legend(ncol=2))
)
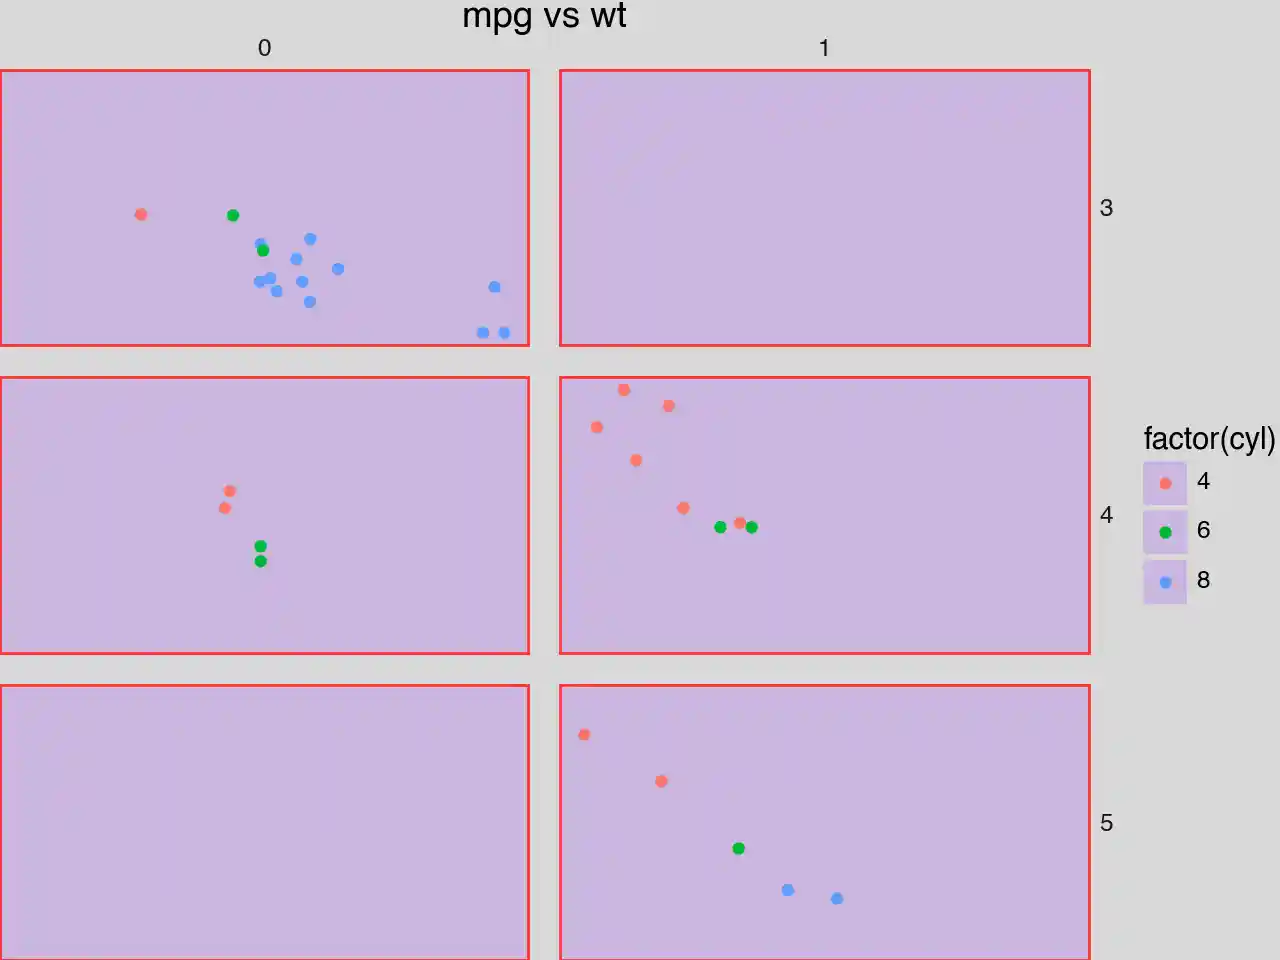
plot_background, panel_background and panel_border
p2 + theme(
    plot_background=element_rect(fill="gray", alpha=0.3),
    panel_background=element_rect(fill=purple, alpha=0.2),
    panel_border=element_rect(color=red, size=1),
    panel_spacing=0.025,
)
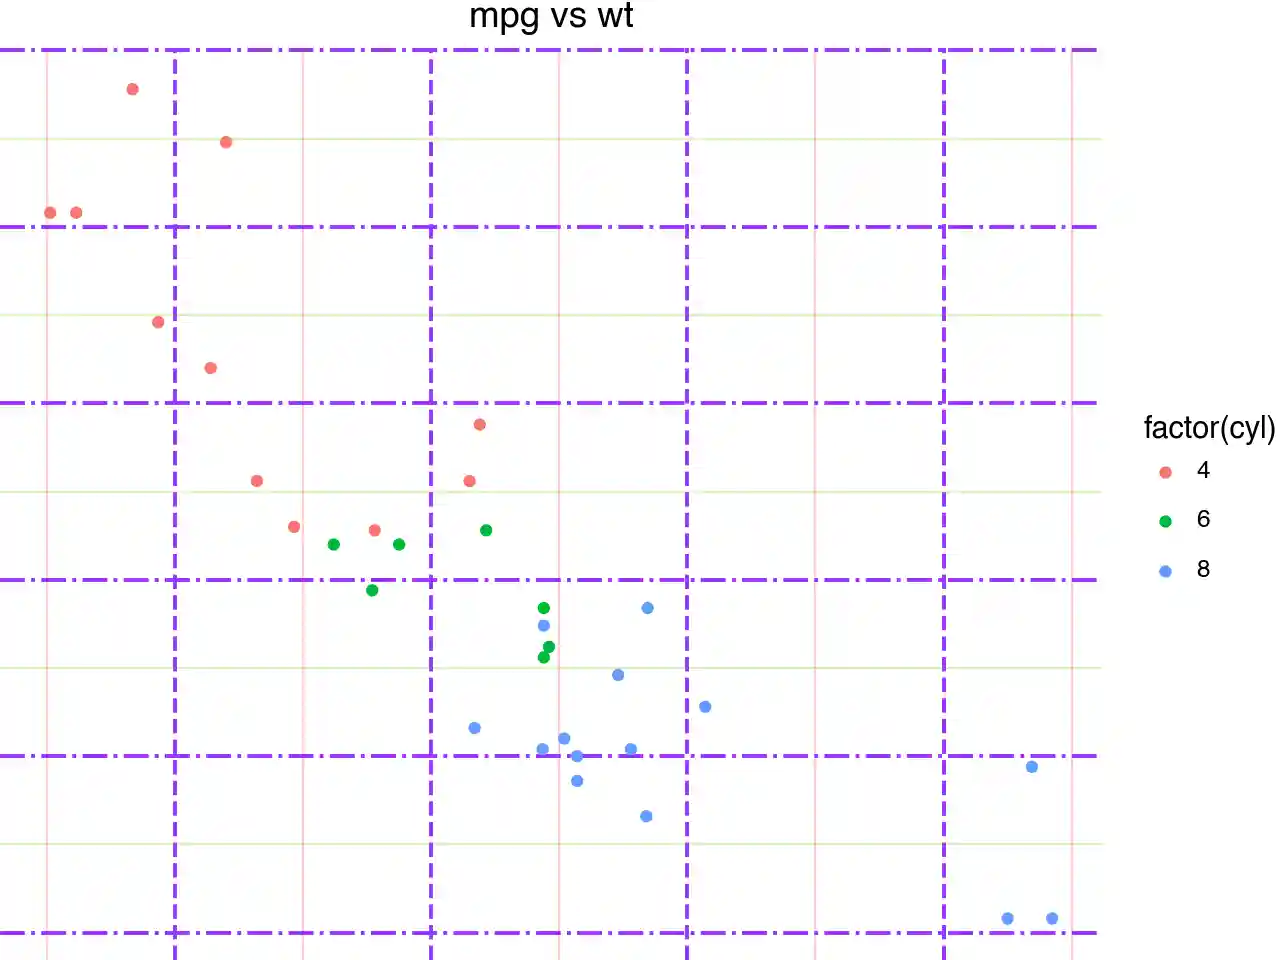
panel_grid
p1 + theme(
    panel_grid=element_line(color=purple),
    panel_grid_major=element_line(size=1.4, alpha=1),
    panel_grid_major_x=element_line(linetype="dashed"),
    panel_grid_major_y=element_line(linetype="dashdot"),
    panel_grid_minor=element_line(alpha=0.25),
    panel_grid_minor_x=element_line(color=red),
    panel_grid_minor_y=element_line(color=green),
    panel_ontop=False,  # puts the points behind the grid
)
strip_background, strip_align and strip_text
p2 + theme(
    panel_spacing=0.025,
    panel_background=element_rect(fill=gray, alpha=0.2),
    strip_background=element_rect(color=purple, fill=orange, size=1.4, alpha=0.95),
    strip_background_x=element_rect(x=1 / 6, width=2 / 3),  # you can get really crazy
    strip_background_y=element_rect(),
    strip_align=0,
    strip_align_x=0.2,
    strip_align_y=0.2,
    strip_text=element_text(weight="bold"),
    strip_text_x=element_text(color=red),
    strip_text_y=element_text(color=blue),
)
aspect_ratio and figure_size
The aspect_ratio takes precedence over the figure_size, and it modifies the height. The effective width and height are:
width = figure_size[0]
height = figure_size[0] * aspect_ratio
p1 + theme(
panel_background=element_rect(fill=gray, alpha=0.2),
figure_size=(8, 6), # inches
aspect_ratio=1 / 3, # height:width
)
Source: We use theme_void as the base theme so that the modifications
Methods
| Name | Description |
|---|---|
| add_theme | Add themes together |
| apply | Apply this theme, then apply additional modifications in order. |
| get_margin | Return the margin propery of a element_text themeables |
| setup | Setup theme for applying |
| to_retina | Return a retina-sized version of this theme |
Add themes together
Subclasses should not override this method.
This will be called when adding two instances of class ‘theme’ together. A complete theme will annihilate any previous themes. Partial themes can be added together and can be added to a complete theme.
Apply this theme, then apply additional modifications in order.
This method will be called once after plot has completed. Subclasses that override this method should make sure that the base class method is called.
Return the margin propery of a element_text themeables
Setup theme for applying
This method will be called when the figure and axes have been created but before any plotting or other artists have been added to the figure. This method gives the theme and the elements references to the figure and/or axes.
It also initialises where the artists to be themed will be stored.
Return a retina-sized version of this theme
The result is a theme that has double the dpi.