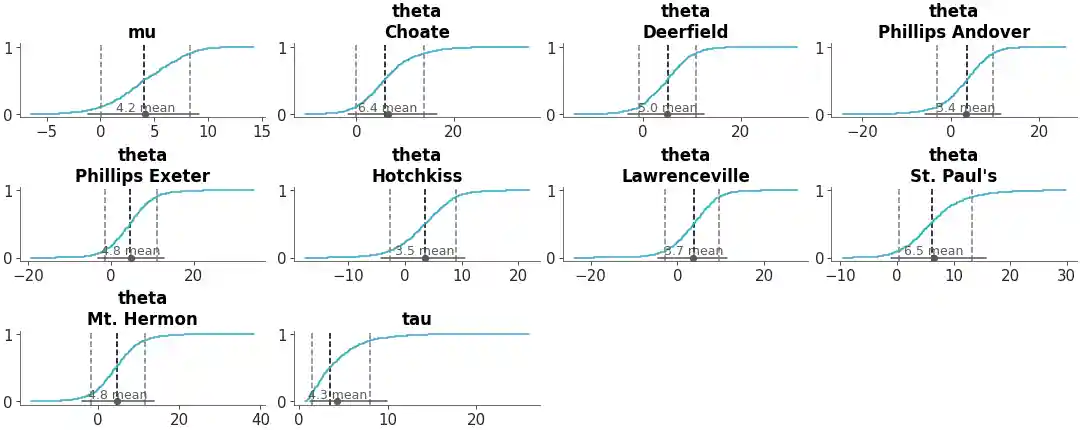
Posterior ECDFs#
Faceted ECDF plots for 1D marginals of the distribution
from arviz_base import load_arviz_data

import arviz_plots as azp

azp.style.use("arviz-variat")

data = load_arviz_data("centered_eight")
pc = azp.plot_dist(
    data,
    kind="ecdf",
    col_wrap=4,
    backend="none"  # change to preferred backend
)
pc.show()
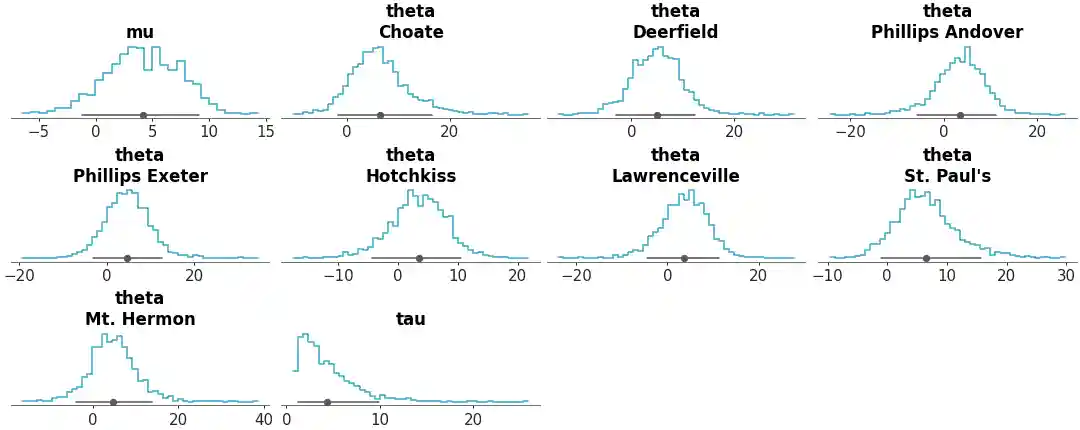
Other examples with plot_dist#
Faceted histogram plots for 1D marginals of the distribution. The point_estimate_text option is set to False to omit that visual from the plot.
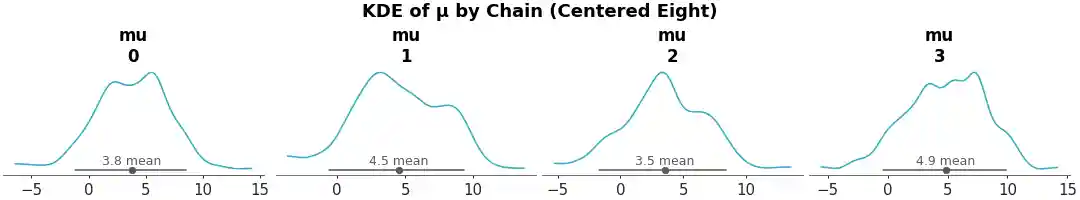
KDE plot of the variable mu from the centered eight model. The sample_dims parameter is used to restrict the KDE computation along the draw dimension only.
Quantile dot plot of the variable mu from the centered eight model. We have removed the point estimate text and changed the number of quantiles to 200.

Draw lines on plots to highlight specific thresholds, targets, or important values.