5.5. Chart Box — Python
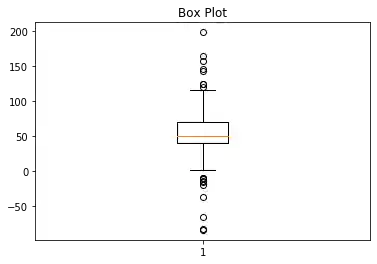
5.5.1. Simple Box Charts
import matplotlib.pyplot as plt
import numpy as np
np.random.seed(0)


spread = np.random.rand(50) * 100
center = np.ones(25) * 50
flier_high = np.random.rand(10) * 100 + 100
flier_low = np.random.rand(10) * -100
data = np.concatenate((spread, center, flier_high, flier_low), 0)

plt.boxplot(data)
plt.title('Box Plot')

plt.show()  # doctest: +SKIP
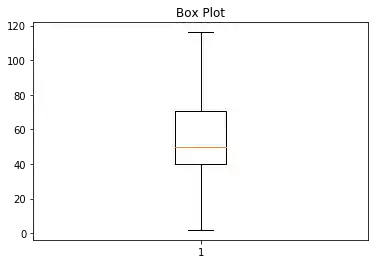
5.5.2. Hide Outliers
import matplotlib.pyplot as plt
import numpy as np
np.random.seed(0)

# fake up some data
spread = np.random.rand(50) * 100
center = np.ones(25) * 40
flier_high = np.random.rand(10) * 100 + 100
flier_low = np.random.rand(10) * -100
d2 = np.concatenate((spread, center, flier_high, flier_low))
data.shape = (-1, 1)
d2.shape = (-1, 1)
data = [data, d2, d2[::2,0]]

plt.boxplot(data)
plt.title('Box Plot')

plt.show()  # doctest: +SKIP
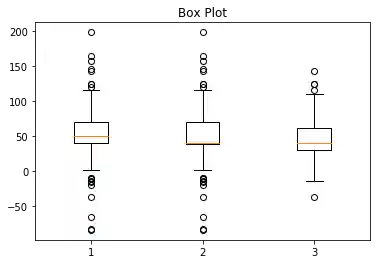
5.5.3. Multiple Box Charts
import matplotlib.pyplot as plt
import numpy as np
np.random.seed(0)

# fake up some data
spread = np.random.rand(50) * 100
center = np.ones(25) * 40
flier_high = np.random.rand(10) * 100 + 100
flier_low = np.random.rand(10) * -100
d2 = np.concatenate((spread, center, flier_high, flier_low))
data.shape = (-1, 1)
d2.shape = (-1, 1)
data = [data, d2, d2[::2,0]]

plt.boxplot(data)
plt.title('Box Plot')

plt.show()  # doctest: +SKIP