5.6. Chart Stacked — Python
Display sections in whole group
5.6.1. No labels
import matplotlib.pyplot as plt


days = [1, 2, 3, 4, 5]

todo        = [4, 3, 3, 2, 0]
in_progress = [6, 6, 5, 5, 2]
in_tests    = [0, 1, 2, 2, 5]
done        = [0, 0, 0, 1, 3]


plt.stackplot(days, todo, in_progress, in_tests, done, colors=['m', 'c', 'r', 'b'])

plt.xlabel('Sprint day')
plt.ylabel('Number of issues')
plt.title('Stacked Plot')
plt.legend()

plt.show()  # doctest: +SKIP
5.6.2. With labels
import matplotlib.pyplot as plt


days = [1, 2, 3, 4, 5]

todo        = [4, 3, 3, 2, 0]
in_progress = [6, 6, 5, 5, 2]
in_tests    = [0, 1, 2, 2, 5]
done        = [0, 0, 0, 1, 3]

plt.plot([], [], color='m', linewidth=5, label='todo')
plt.plot([], [], color='c', linewidth=5, label='in_progress')
plt.plot([], [], color='r', linewidth=5, label='in_tests')
plt.plot([], [], color='b', linewidth=5, label='done')

plt.stackplot(days, todo, in_progress, in_tests, done, colors=['m', 'c', 'r', 'b'])

plt.xlabel('Sprint day')
plt.ylabel('Number of issues')
plt.title('Stacked Plot')
plt.legend(loc='upper left')

plt.show()  # doctest: +SKIP
5.6.3. Stack plot
import matplotlib.pyplot as plt


days = [1, 2, 3, 4, 5]
labels = ['To Do', 'In Progress', 'In Test', 'In Review', 'Done']

# how many issues were in each status on given day
todo        = [10, 8, 6, 4, 2]
in_progress = [2, 3, 4, 3, 2]
in_test     = [7, 8, 7, 2, 2]
in_review   = [8, 5, 7, 8, 1]
done        = [0, 2, 4, 6, 12]

plt.stackplot(days, todo, in_progress, in_test, in_review, done, labels=labels)
plt.legend(loc='upper left')

plt.show()  # doctest: +SKIP
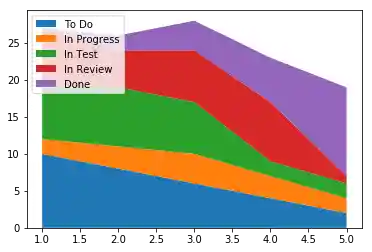
Figure 5.19. Stack plot