Nyström approximation for OT — POT Python Optimal Transport 0.9.6 documentation
Note
Go to the end to download the full example code.
Shows how to use Nyström kernel approximation for approximating the Sinkhorn algorithm in linear time.
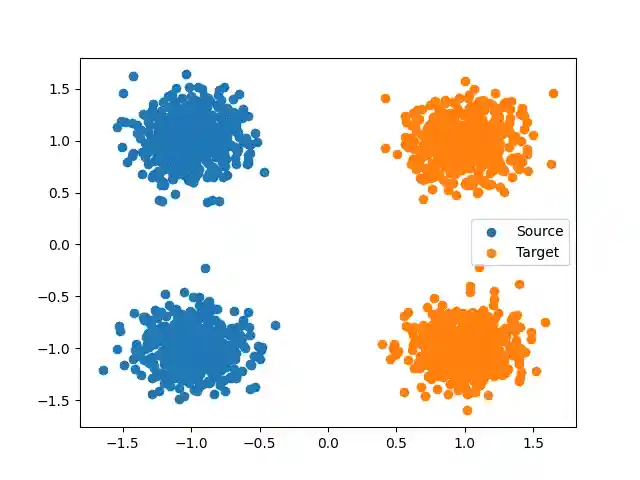
Generate data
offset = 1
n_samples_per_blob = 500  # We use 2D ''blobs'' data
random_state = 42
std = 0.2  # standard deviation
np.random.seed(random_state)

centers = np.array(
    [
        [-offset, -offset],  # Class 0 - blob 1
        [-offset, offset],  # Class 0 - blob 2
        [offset, -offset],  # Class 1 - blob 1
        [offset, offset],  # Class 1 - blob 2
    ]
)

X_list = []
y_list = []

for i, center in enumerate(centers):
    blob_points = np.random.randn(n_samples_per_blob, 2) * std + center
    label = 0 if i < 2 else 1
    X_list.append(blob_points)
    y_list.append(np.full(n_samples_per_blob, label))

X = np.vstack(X_list)
y = np.concatenate(y_list)
Xs = X[y == 0]  # source data
Xt = X[y == 1]  # target data
Plot data
<matplotlib.legend.Legend object at 0x7f95a5b99900>
Compute the Nyström approximation of the Gaussian kernel
Elapsed time : 0.0009199740006806678 s

0.0009199740006806678
Use this approximation in a Sinkhorn algorithm with low rank kernel. Each matrix/vector product in the Sinkhorn is accelerated since \(Kv = K_1 (K_2^\top v)\) can be computed in \(O(nr)\) time instead of \(O(n^2)\)
numItermax = 1000
stopThr = 1e-7
verbose = True
a, b = None, None
warn = True
warmstart = None
ot.tic()
u, v, dict_log = sinkhorn_low_rank_kernel(
    K1=left_factor,
    K2=right_factor,
    a=a,
    b=b,
    numItermax=numItermax,
    stopThr=stopThr,
    verbose=verbose,
    log=True,
    warn=warn,
    warmstart=warmstart,
)
ot.toc()
It.  |Err
-------------------
    0|7.482235e-05|
Elapsed time : 0.0010642120005286415 s

0.0010642120005286415
Compare with Sinkhorn
M = ot.dist(Xs, Xt)
ot.tic()
G, log_ = ot.sinkhorn(
    a=[],
    b=[],
    M=M,
    reg=reg,
    numItermax=numItermax,
    verbose=verbose,
    log=True,
    warn=warn,
    warmstart=warmstart,
)
ot.toc()
It.  |Err
-------------------
    0|7.517180e-05|
Elapsed time : 0.022354896000251756 s

0.022354896000251756
Use directly ot.bregman.empirical_sinkhorn_nystroem
It.  |Err
-------------------
    0|7.482235e-05|
Elapsed time : 0.004702213000200572 s

0.004702213000200572
It.  |Err
-------------------
    0|7.517180e-05|
Elapsed time : 0.10144615999979578 s

0.10144615999979578
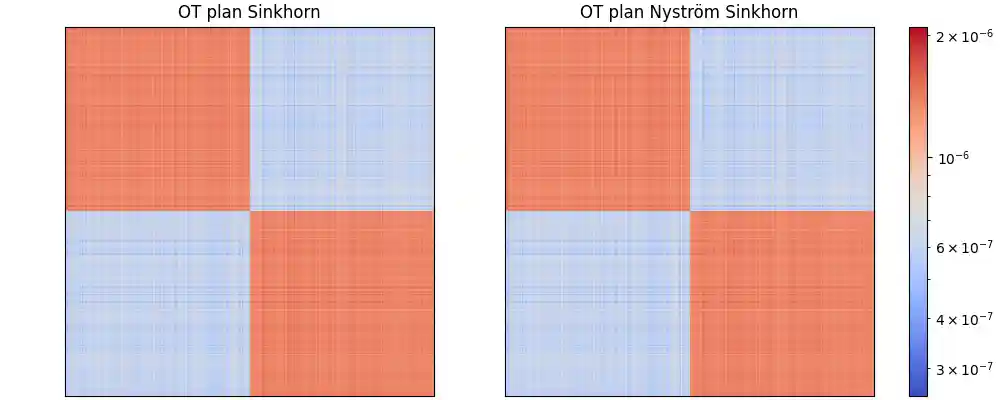
Compare OT plans
fig, ax = plt.subplots(1, 2, figsize=(10, 4), constrained_layout=True)
vmin = min(G_sinkh.min(), G_nys.min())
vmax = max(G_sinkh.max(), G_nys.max())
norm = LogNorm(vmin=vmin, vmax=vmax)
im0 = ax[0].imshow(G_sinkh, norm=norm, cmap="coolwarm")
im1 = ax[1].imshow(G_nys, norm=norm, cmap="coolwarm")
cbar = fig.colorbar(im1, ax=ax, orientation="vertical", fraction=0.046, pad=0.04)
ax[0].set_title("OT plan Sinkhorn")
ax[1].set_title("OT plan Nyström Sinkhorn")
for a in ax:
    a.set_xticks([])
    a.set_yticks([])
plt.show()
Total running time of the script: (0 minutes 2.574 seconds)