Nyström approximation for OT — POT Python Optimal Transport 0.9.7.dev0 documentation
Note
Go to the end to download the full example code.
Shows how to use Nyström kernel approximation for approximating the Sinkhorn algorithm in linear time.
Generate data
offset = 1
n_samples_per_blob = 500  # We use 2D ''blobs'' data
random_state = 42
std = 0.2  # standard deviation
np.random.seed(random_state)

centers = np.array(
    [
        [-offset, -offset],  # Class 0 - blob 1
        [-offset, offset],  # Class 0 - blob 2
        [offset, -offset],  # Class 1 - blob 1
        [offset, offset],  # Class 1 - blob 2
    ]
)

X_list = []
y_list = []

for i, center in enumerate(centers):
    blob_points = np.random.randn(n_samples_per_blob, 2) * std + center
    label = 0 if i < 2 else 1
    X_list.append(blob_points)
    y_list.append(np.full(n_samples_per_blob, label))

X = np.vstack(X_list)
y = np.concatenate(y_list)
Xs = X[y == 0]  # source data
Xt = X[y == 1]  # target data
Plot data
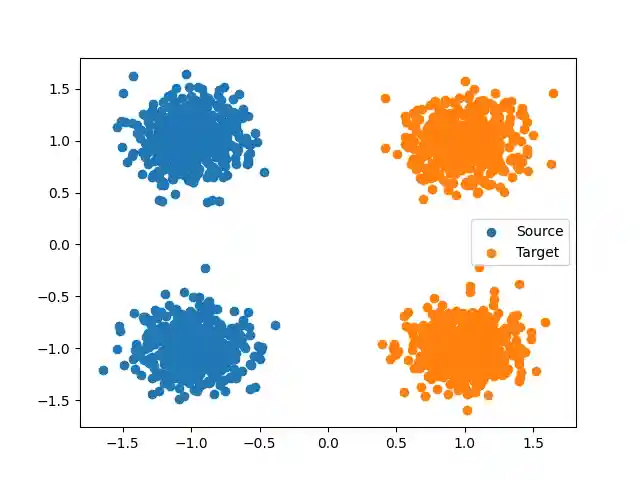
<matplotlib.legend.Legend object at 0x7f028df779d0>
Compute the Nyström approximation of the Gaussian kernel
Elapsed time : 0.0009130439975706395 s

0.0009130439975706395
Use this approximation in a Sinkhorn algorithm with low rank kernel. Each matrix/vector product in the Sinkhorn is accelerated since \(Kv = K_1 (K_2^\top v)\) can be computed in \(O(nr)\) time instead of \(O(n^2)\)
numItermax = 1000
stopThr = 1e-7
verbose = True
a, b = None, None
warn = True
warmstart = None
ot.tic()
u, v, dict_log = sinkhorn_low_rank_kernel(
    K1=left_factor,
    K2=right_factor,
    a=a,
    b=b,
    numItermax=numItermax,
    stopThr=stopThr,
    verbose=verbose,
    log=True,
    warn=warn,
    warmstart=warmstart,
)
ot.toc()
It.  |Err
-------------------
    0|7.482235e-05|
Elapsed time : 0.001006858998152893 s

0.001006858998152893
Compare with Sinkhorn
M = ot.dist(Xs, Xt)
ot.tic()
G, log_ = ot.sinkhorn(
    a=[],
    b=[],
    M=M,
    reg=reg,
    numItermax=numItermax,
    verbose=verbose,
    log=True,
    warn=warn,
    warmstart=warmstart,
)
ot.toc()
It.  |Err
-------------------
    0|7.517180e-05|
Elapsed time : 0.01383744399936404 s

0.01383744399936404
Use directly ot.bregman.empirical_sinkhorn_nystroem
It.  |Err
-------------------
    0|7.482235e-05|
Elapsed time : 0.003619695002271328 s

0.003619695002271328
It.  |Err
-------------------
    0|7.517180e-05|
Elapsed time : 0.040229270001873374 s

0.040229270001873374
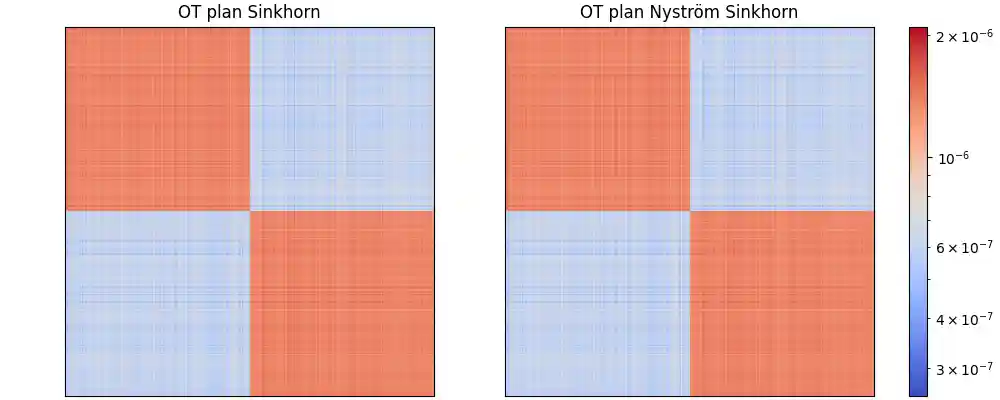
Compare OT plans
fig, ax = plt.subplots(1, 2, figsize=(10, 4), constrained_layout=True)
vmin = min(G_sinkh.min(), G_nys.min())
vmax = max(G_sinkh.max(), G_nys.max())
norm = LogNorm(vmin=vmin, vmax=vmax)
im0 = ax[0].imshow(G_sinkh, norm=norm, cmap="coolwarm")
im1 = ax[1].imshow(G_nys, norm=norm, cmap="coolwarm")
cbar = fig.colorbar(im1, ax=ax, orientation="vertical", fraction=0.046, pad=0.04)
ax[0].set_title("OT plan Sinkhorn")
ax[1].set_title("OT plan Nyström Sinkhorn")
for a in ax:
    a.set_xticks([])
    a.set_yticks([])
plt.show()
Total running time of the script: (0 minutes 1.274 seconds)